TORONTO--(Marketwired - Aug 28, 2013) - TransUnion's quarterly analysis of Canadian credit trends found that the average consumer's total debt (excluding mortgage) in Q2 2013 increased nearly $200 to $27,131. This comes one quarter after the nation experienced its first quarterly decline in over two years.
On a year-over-year basis, total debt increased 3.47% from $26,221 in Q2 2012. The year-over-year increase this quarter was much greater than what has been experienced during Q2 the previous two years, indicating that the Q1 pull back from earlier this year may have been a one-time event.
"After the unexpected first quarter decrease in consumer debt, the variable climbed back up in the second quarter with a larger than normal rise," said Thomas Higgins, TransUnion's vice president of analytics and decision services. "This points to Canadian consumers' continued appetite for credit as an instrument to make purchases. TransUnion forecasts total debt to continue to grow through the remainder of the year, likely eclipsing the record high set in Q4 2012."
| Actual | Forecast | |||||||||||
| Q3 2012 | Q4 2012 | Q1 2013 | Q2 2013 | Q3 2013 | Q4 2013 | |||||||
| Debt per Person | $26,768 | $27,485 | $26,935 | $27,131 | $27,497 | $27,725 | ||||||
| Q/Q chg | 2.09% | 2.68% | -2.00% | 0.73% | 1.35% | 0.83% | ||||||
| Y/Y chg | 4.59% | 5.87% | 3.48% | 3.47% | 2.72% | 0.87% | ||||||
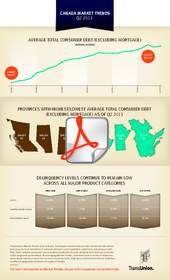
The increase in average debt was consistent throughout Canada, with all provinces experiencing increases from a low in Ontario of 1.84% to a high in Alberta of 7.70%.
| Avg Consumer Debt |
Q2 2012 | Q3 2012 | Q4 2012 | Q1 2013 | Q2 2013 | Q/Q Chg | Y/Y Chg | |||||||
| Canada | $26,221 | $26,768 | $27,485 | $26,935 | $27,131 | 0.73% | 3.47% | |||||||
| British Columbia | $37,879 | $38,837 | $37,244 | $38,619 | $38,672 | 0.14% | 2.09% | |||||||
| Alberta | $33,564 | $33,688 | $37,377 | $36,223 | $36,150 | -0.02% | 7.70% | |||||||
| Ontario | $25,447 | $25,937 | $26,901 | $25,735 | $25,914 | 0.70% | 1.84% | |||||||
| Quebec | $18,580 | $19,174 | $20,102 | $19,131 | $19,455 | 1.70% | 4.71% | |||||||
Consumer Debt - Quarterly/Yearly
Total consumer debt increases were seen across all product categories.
- Canadian average credit card borrower debt (defined as the aggregate balance on all credit cards for an individual bankcard borrower) posted a strong quarterly increase of 3.53%, helping to post the first year over year increase (0.80%) in over 3 years.
- Canadian lines of credit (LOC) borrower debt (defined as the aggregate balance on all LOC for an individual LOC borrower) maintained its year over year growth trend for Q2, up 2.73%, while posting its second consecutive decrease of -0.89% quarter over quarter.
- Canadian installment loan borrower debt (defined as the aggregate balance on all installment loans for an individual installment loan borrower) increased 5.52% year over year, its third consecutive quarter above 5%, and 2.00% quarter over quarter.
- Canadian auto borrower debt (defined as the aggregate balance on all auto captive loans for an individual auto captive borrower) increased 3.38% year over year, continuing its decelerating growth path over the past several quarters.
"While there was an increase in debt for credit cards, installment loans and auto loans, there was a second straight quarterly decline in lines of credit, which is important to note because it is by far the largest credit segment," said Higgins. "Lines of Credit debt has grown in the last few years, but the extent of the growth is much smaller than what we've observed with both auto and installment loans."
| Q4 2011 |
Q1 2012 |
Q2 2012 |
Q3 2012 |
Q4 2012 |
Q1 2013 |
Q2 2013 |
||||||||
| Credit Cards | $3,633 | $3,462 | $3,556 | $3,573 | $3,637 | $3,463 | $3,585 | |||||||
| Lines of Credit | $34,340 | $34,107 | $33,721 | $34,050 | $35,247 | $34,951 | $34,641 | |||||||
| Installment Loans | $21,764 | $21,974 | $22,493 | $22,849 | $23,224 | $23,269 | $23,735 | |||||||
| Auto Captives | $17,759 | $18,212 | $18,881 | $19,228 | $19,345 | $19,172 | $19,518 | |||||||
Consumer Delinquencies - Quarterly/Yearly
Delinquency levels remained low for all credit products with lines of credit and auto captives continuing to have the lowest percentages.
"Debt levels have risen at a rather fast pace the last several years, but it is important to note that delinquency levels have either remained about the same or even dropped during this same time period," Higgins noted. "This is particularly important to note for lenders as despite more consumers gaining access to credit in recent years, delinquencies have not risen in a material way, meaning consumers, for now, are able to effectively manage their increased debt load."
| Q2 2012 | Q3 2012 | Q4 2012 | Q1 2013 | Q2 2013 | Q/Q Chg | Y/Y Chg | ||||||||
| Credit Cards | 0.29% | 0.30% | 0.30% | 0.32% | 0.24% | -25.0% | -18.0% | |||||||
| Lines of Credit | 0.19% | 0.19% | 0.18% | 0.18% | 0.17% | -7.5% | -10.4% | |||||||
| Installment Loans | 1.24% | 1.22% | 1.18% | 1.18% | 1.14% | -3.59% | -7.7% | |||||||
| Auto Captives | 0.08% | 0.10% | 0.10% | 0.10% | 0.10% | -4.39% | 13.1% | |||||||
Three Highest Delinquency Provinces
| Credit Cards | Lines of Credit | Installment Loans | Auto Captives |
| PEI 0.50% | BC 0.24% | ON 1.87% | MB 0.27% |
| NB 0.42% | ON 0.19% | NS 1.54% | NB 0.15% |
| NS 0.36% | PEI 0.20% | PEI 1.57% | NS 0.16% |
Three Lowest Delinquency Provinces
| Credit Cards | Lines of Credit | Installment Loans | Auto Captives |
| QC 0.17% | QC 0.09% | QC 0.38% | QC 0.09% |
| SK 0.20% | NL 0.10% | NL 0.96% | BC 0.06% |
| BC 0.25% | SK 0.12% | SK 0.96% | PEI 0.05% |
TransUnion's Market Trends
TransUnion's Market Trends is an in-depth, full sample solution that provides statistical information every quarter from TransUnion's national consumer credit database, culled from anonymous credit files. Each Canadian consumer record contains hundreds of credit variables that illustrate consumer credit usage and performance. By leveraging Market Trends, customers from a variety of industries can analyze industry trends over an entire business cycle, helping to understand consumer behaviour in different geographic locations throughout Canada.
About TransUnion
As a global leader in information and risk management, TransUnion creates advantages for millions of people around the world by gathering, analyzing and delivering information. For businesses, TransUnion helps improve efficiency, manage risk, reduce costs and increase revenue by delivering high quality data, and integrating advanced analytics and enhanced decision-making capabilities. For consumers, TransUnion provides the tools, resources and education to help manage their credit health and achieve their financial goals. Through these and other efforts, TransUnion is working to build stronger economies worldwide. Based in Burlington, Ontario, with global headquarters located in Chicago, Illinois, TransUnion provides local service and support throughout Canada. Visit www.transunion.ca to learn more.
Contact Information:
Contact
Dave Blumberg
TransUnion
E-mail
Telephone 1 312 972 6646