TORONTO, ONTARIO--(Marketwire - May 8, 2012) - The Ontario preliminary Seasonally Adjusted Annual Rate (SAAR) of home starts across urban* centres reached an estimated 95,400** residential housing units in the latest month, up from 85,000 units in March. While multi-family home construction, pushed construction activity higher, single detached construction also moved higher. While the GTA was the source of strength in March, April strength was witnessed in other markets across the province. Ontario housing starts for the year ending April are running 30 per cent above the same period in 2011.
"Residential construction activity is running strong and above trend levels in April," said Ted Tsiakopoulos, CMHC's Ontario Regional Economist. "Given uncertainty regarding labour conditions and financing, builders have been breaking ground quicker on projects sold out in the past. Meanwhile, tight resale markets for singles and low unsold inventories helped single detached construction grow in April. Modest job growth, rising apartment inventories, high home prices and more balanced resale markets should temper gains ahead," added Tsiakopoulos.
As Canada's national housing agency, CMHC draws on over 65 years of experience to help Canadians access a variety of high quality, environmentally sustainable and affordable homes. CMHC also provides reliable, impartial and up-to-date housing market reports, analysis and knowledge to support and assist consumers and the housing industry in making informed decisions.
For more information, visit www.cmhc.ca or call 1-800-668-2642. CMHC Market Analysis standard reports are also available free for download at CMHC Housing Market Information.
(Ce document existe également en français)
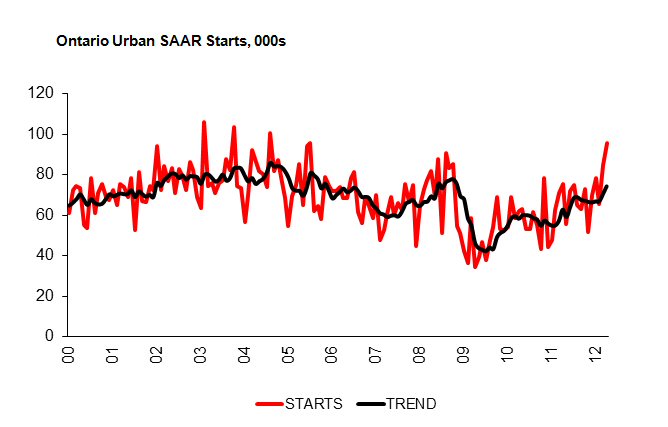
To view the "Ontario Urban SAAR Starts, 000s," graph, please visit the following link: http://media3.marketwire.com/docs/OUrbanSAAR_ang.jpg.
*Refers to provincial starts in areas with population 10,000+ (urban)
**Starts figures in this release, other than actual starts, are seasonally adjusted annual rates (SAAR)-that is, monthly figures adjusted to remove normal seasonal variation and multiplied by 12 to reflect annual levels
| Ontario Starts, Urban 10,000 and Over - 2012 SAAR | ||||
| February | March | April | % Change | |
| Total | 65,300 | 85,000 | 95,400 | 12.2% |
| Single | 24,700 | 24,100 | 26,000 | 7.9% |
| Multiple | 40,600 | 60,900 | 69,400 | 14.0% |
| Ontario Actual Starts, Urban 10,000+ | ||||||
| April | Year-to-Date | |||||
| 2011 | 2012 | % Change | 2011 | 2012 | % Change | |
| Total | 6,157 | 7,803 | 26.7% | 18,414 | 23,848 | 29.5% |
| Single | 1,863 | 2,154 | 15.6% | 5,801 | 6,142 | 5.9% |
| Multiple | 4,294 | 5,649 | 31.6% | 12,613 | 17,706 | 40.4% |
Contact Information:
Ontario Regional Economist
(416) 218-3407
ttsiakop@cmhc.ca