TRUCKEE, CA--(Marketwire - Jun 9, 2011) - Clear Capital (www.clearcapital.com) today released its monthly Home Data Index™ (HDI) Market Report, with the news that U.S. home prices continue a downward trend. This month's HDI Market Report provides the most current data (through June 2011), and relevant analysis of how local markets performed compared to the national trend in home prices.
Report highlights include:
- National quarter-over-quarter home price declines (-2.3%) were reduced by half from last month's report, helped by stronger spring sales activity. National yearly price declines reach -7.6%, offset from last year's tax credit induced highs.
- U.S. REO saturation rate slipped to 33.9%, down 0.6% from last month's report.
- Quarterly home price change of -13.2% keeps Detroit Metropolitan Statistical Area (MSA) the lowest performing market for the fifth consecutive month.
"The latest Market Report results through May suggest that home prices are starting to ease back from the heavy declines seen over the winter," said Dr. Alex Villacorta, director of research and analytics at Clear Capital. "We are still far away from the strong demand needed to fully turn things around for the housing market; however, it is clear from the initial spring sales data that prices are softening, suggesting stabilization in the market.
"The saturation rate has leveled off after climbing 10 percent since July 2010, with the latest data showing national REO saturation holding steady at 33 percent," added Villacorta. "The median price paid for distressed properties has risen over the past three quarters, which is a good sign that the REO market segment is seeing increased activity toward the upper end of this space."
National/Four Region Market Overview (May 2010 - June 2011)
Prices Remain Down, Hope Found in Distressed Home Base
- National quarterly home price declines were reduced by half, dropping to -2.3% this month, compared to the -4.9% price change posted in last month's report.
- National REO saturation remained high, but dropped 0.6 percentage points to 33.9%.
- Regional quarterly price declines also softened across the nation, with the Northeast, West and South regions all posting declines of less than 2.0%.
- Year-over-year home prices are down nationally 7.6%, matching price levels last experienced in 2000.
One month after reporting a nation-wide double dip in home prices, quarter-over-quarter home prices are showing signs of improvement as the deep winter lows were replaced by more stable spring prices. This softening of price declines suggests prices are stabilizing as the typically stronger summer buying season approaches. Based on historical patterns, the non-REO ("fair market") segment increases its share of total sales volume in the spring and summer months, which is critical as past HDI Market Reports have shown the near perfect negative correlations between home prices and overall REO saturation.
The present leveling of quarterly declines is expected. All spring seasons, even since the 2006 downturn, have seen an increase in fair market sales volume (14% on average), compared to the preceding winter. The REO segment doesn't typically follow a seasonal cycle because the release of distressed properties to the market is determined through the foreclosure process and sales driven by different marketing strategies (such as those who wish to liquidate within weeks, versus those with longer marketing horizons). With sale transactions still filtering in from the spring months, it is too early to determine if this spring will match historical averages. After this past dismal winter of volume and prices, spring sales will need to be high to achieve price gains typical of the summer buying season.
The seasonal rise in non-REO volumes is now merging with a new trend; in Q4 2010, the median price for distressed properties crept upward 5.0 percent while REO sale volumes have moderated. This marks the longest gain in median price for REOs since the market correction began in 2006. This is a positive signal at minimum; it indicates buyers' appetite for higher-end REOs. Even with elevated distressed activity, this introduces the potential for gains in spite of overall low volumes.
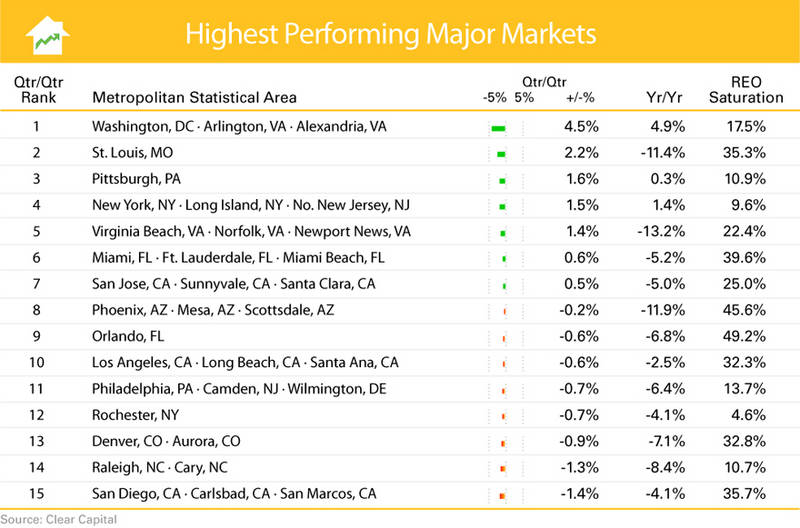
Metro Markets (May 2010 - June 2011)
Select Markets Starting to Heat up in Time for Summer
- Seven of the top 15 markets posted quarter-over-quarter price gains, compared to zero in last month's report.
- REO saturation rates for all 15 of the highest performing markets improved this month, compared to last month's report.
- 12 of the 15 highest performing major markets are still experiencing year-over-year declines.
As winter home prices are replaced with early spring numbers, individual markets are showing signs of recovery. All 15 of the highest performing markets posted improved quarterly gains compared to last month's report. Peak REO saturation rates have subsided for now and the beginning of the typically positive spring and summer buying season have again started leading the quarterly price changes in a positive direction.
Washington, D.C., Pittsburgh and New York experienced both positive quarterly and yearly price changes. The majority of local markets, however, are still experiencing yearly declines off of last year's federal tax credit highs. Additionally, all markets except for Miami, New York, Virginia Beach and Washington D.C. saw yearly price changes deteriorate from last month's report.
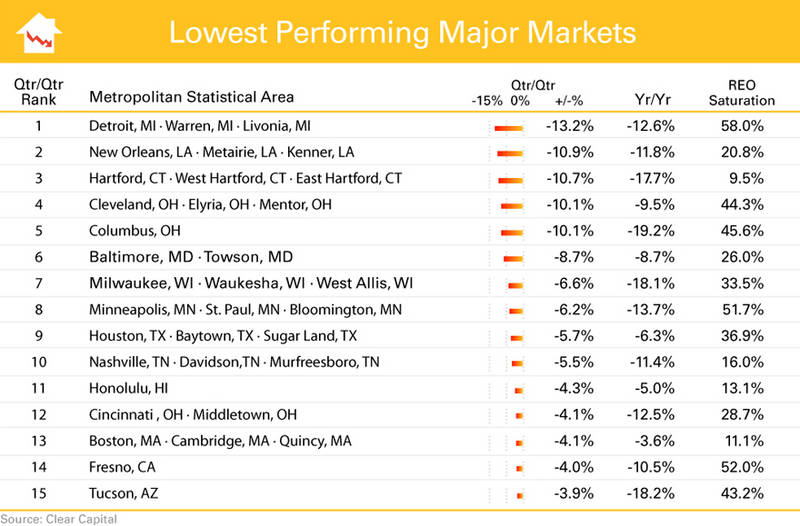
Yearly Prices Suffer Post 2010 Tax Credit, 2011 REO Saturation Highs
- Detroit's -13.2% quarter-over-quarter home price change keeps it ranked among the lowest performing markets list for the fifth consecutive month.
- Ten of the fifteen markets experienced double-digit year-over-year price declines.
- Nearer-term quarter-over-quarter price changes improved slightly, with ten markets reporting softer declines.
Like the rest of the nation, the lowest performing markets experienced a slight softening in price declines in the most recent quarter compared to last month's report; while year-over-year price changes continued to erode, deteriorating in all 15 markets.
Midwest markets of Detroit, Cleveland and Columbus continue to be hit particularly hard, posting three of the largest quarterly price declines. The nationwide uptick in distressed home prices were absent in these three markets. REO saturation rates well above 40 and 50 percent (Detroit, 58.0%; Cleveland, 44.3%; Columbus, 45.6%) pushed these markets to double-digit quarter-over-quarter home price declines.
About the Clear Capital Home Data Index (HDI) Market Report
The Clear Capital HDI Market Report has displayed consistent market trends as other leading indices (peak, trough, secondary trough and tax credit run-ups). Despite these consistencies, a critical difference is that HDI's methodology enables more timely and granular reporting.
The Clear Capital HDI Market Report:
- Offers the real estate industry (investors, lenders and servicers), government agencies and the public insight into the most recent pricing conditions, not only at the national and metropolitan level, but within local markets as well.
- Is built on the most recent information available from recorder/assessor offices, and then further enhanced by adding the company's proprietary streaming market data for the most comprehensive geographic coverage and local insights available.
- Reflects nationwide coverage of sales transactions and aggregates this comprehensive dataset at ten different geographic levels, including hundreds of metropolitan statistical areas (MSAs) and sub-ZIP code boundaries.
- Includes equally-weighted distressed bank owned sales (REOs) from around the country to give the most real world look of pricing dynamics across all sales types.
- Allows for the most current market data by providing more frequent updates with patent-pending rolling quarter technology. This ensures decisions are based on the most up-to-date information available.
Clear Capital Home Data Index™ Methodology
- Generates the timeliest indices in patent pending rolling quarter intervals that compare the most recent four months to the previous three months. The rolling quarters have no fixed start date and can be used to generate indices as data flows in, significantly reducing the multi-month lag time experienced with other indices.
- Includes both fair market and institutional (real estate owned) transactions, giving equal weight to all market transactions and identifying price tiers at a market specific level. By giving equal weight to all transactions the HDI is truly representative of each unique market.
- Results from an address-level cascade create an index with the most granular, statistically significant market area available.
- Provides weighted repeat sales, and price-per-square-foot index models that use multiple sale types, including single-family homes, multi-family homes and condominiums.
About Clear Capital
Clear Capital (www.clearcapital.com) is a premium provider of data and solutions for real estate asset valuation and risk assessment for large financial services companies. Our products include appraisals, broker-price opinions, property condition inspections, value reconciliations, and home data indices. Clear Capital's combination of progressive technology, high caliber in-house staff and a well-trained network of more than 40,000 field experts sets a new standard for accurate, up-to-date and well documented valuation data and assessments. The Company's customers include the largest U.S. banks, investment firms and other financial organizations.
Legend
Address Level Cascade - Provides the most granular market data available. From the subject property, progressively steps out from the smallest market to larger markets until data density and statistical confidence are sufficient to return a market trend.
Home Data Index (HDI) - Powerful analytics tool that provides contextual data augmenting other, human-based valuation tools. Clear Capital's multi-model approach combines address-level accuracy with the most current proprietary home pricing data available.
Metropolitan Statistical Area (MSA) - Geographic entities defined by the U.S. Office of Management and Budget (OMB) for use by Federal statistical agencies in collecting, tabulating, and publishing Federal statistics.
Repeat Sales Model - Weighted linear model based on repeat sales of same property over time.
Price Per Square Foot (PPSF) Model - Median price movement of sale prices divided by square footage over a period of time -- most commonly a quarter.
Real Estate Owned (REO) Saturation - Calculates the percentage of REOs sold as compared to all properties sold in the last rolling quarter.
Rolling Quarters - Patent pending rolling quarters compare the most recent four months to the previous three months.
The information contained in this report is based on sources that are deemed to be reliable; however no representation or warranty is made as to the accuracy, completeness, or fitness for any particular purpose of any information contained herein. This report is not intended as investment advice, and should not be viewed as any guarantee of value, condition, or other attribute.
Contact Information:
Media Contact:
Michelle Sabolich
Atomic PR for Clear Capital
415.593.1400