TRUCKEE, CA--(Marketwire - March 10, 2011) - Clear Capital (www.clearcapital.com) released its monthly Home Data Index™ (HDI) Market Report, and reports a quarter-over-quarter national price change of -1.4 percent. The HDI Market Report provides the most current (through February 2011), granular and relevant analysis of how local markets performed compared to the national trend in home prices.
Report highlights include:
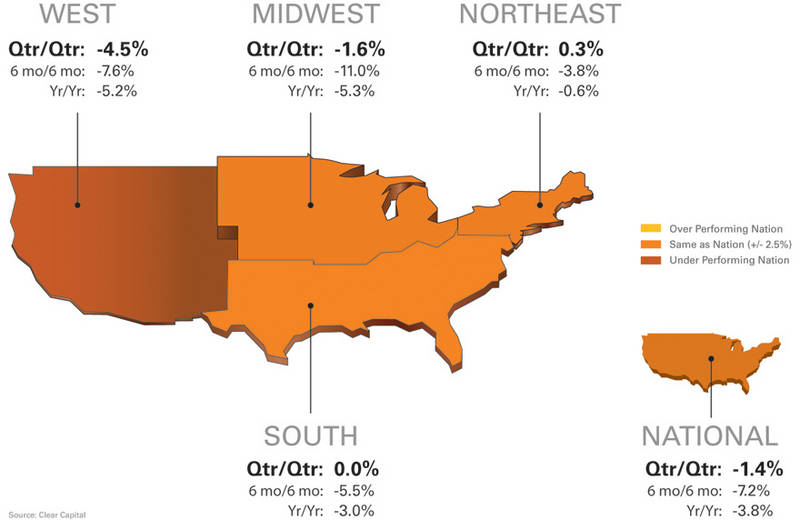
- National home prices continue to drift downward, largely due to the West's quarter-over-quarter declines (-4.5%) that could lead the region into double dip territory as soon as next month.
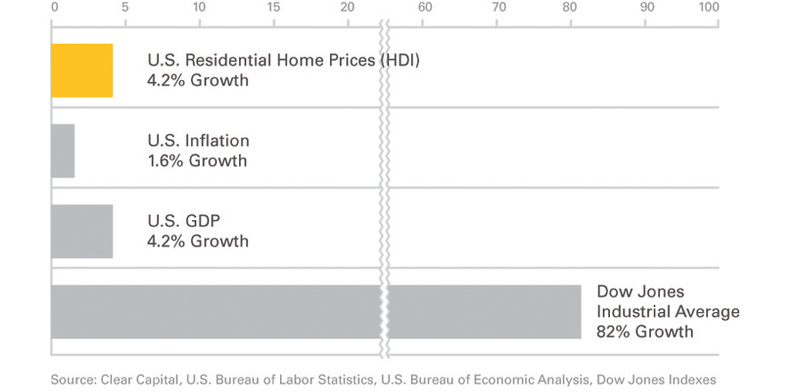
- National home prices are up 4.2% from two years ago, yet the gains of other positive market indicators have yet to extend to the greater housing market.
"Despite distressed inventory pressure and traditional winter inactivity, current trends are continuing to show a softening of price declines," said Dr. Alex Villacorta, director of research and analytics at Clear Capital. "The 3.9 percent quarterly decline we observed in December has given way to moderating declines with the national price index now down only 1.4 percent, suggesting a leveling of prices is on track for spring."
"From a larger perspective, prices are still up 4.2 percent off of the absolute lows of the housing crash, a sign that long term gains can be realized amidst the volatile behavior of the last two years," added Villacorta. "Yet, when comparing this growth to other economic indicators over the same time period, it is clear that the housing market still has a long way to go toward a sustained recovery."
Broader Perspective Revealed
At the end of 2010, Clear Capital's reported -3.9 percent year-over-year national price change was an alarming sign of a housing market absent tax incentives and follow-up to a weak home-buying season. Today, these price declines have paused among some housing markets, giving hope that price stability will prevail over ongoing default pressures. While knowing recent trends is critical to those making immediate decisions, longer term price performance is an important indicator for investors, policy makers, builders and buyers when considering overall market health. These trends help show the current position of the market within longer-term cycles giving a more complete view of how specific policy changes have impacted the market. They also provide a good basis for comparison to other investment vehicles.
In early 2009, national home prices reached a low point amid a near freeze in credit, rapid liquidation of REOs on behalf of institutions trying to stave off insolvency, rapidly rising unemployment (up 3.7% since February 2007), falling GDP (down 2.0% from the first quarter of 2007) and, for perspective, a stock market (Dow Jones) that had fallen 53 percent since its peak in October of 2007.
Broad-based Price Appreciation (Over Last Two Years)
Today, as we look at the current economic environment for home prices compared to 2009, credit is becoming more available (albeit still limited), institutions have a better understanding of distressed pricing and marketing, as well as the damaging effects of flooding the market with distressed inventory. In addition to market participants being better informed, unemployment has finally ticked downward to 8.9 percent from its peak of 10.1 in October of 2009 (Source: U.S. Bureau of Labor Statistics), GDP has ticked up 4.2 percent (Source: U.S. Bureau of Economic Analysis), and the Dow Jones continues to add points on-top of its already impressive 80 percent-plus two-year return.
Even with the advances of other economic indicators, home prices have gained only 4.2 percent nationally over the last two years while some markets and even regions are on the verge of reaching new lows. When considered among the backdrop of core inflation's two year gain of 1.6 percent, these gains are even less impressive. While an 80 percent price gain by the Dow Jones is not a realistic two-year goal for housing, other sectors (precious metals and energy) have also produced significant gains.
These positive signs from other market indicators have yet to extend to the greater housing market as distressed activity and inventories remain highly elevated. Looking ahead, it's important to understand that current price movements at the local level should be digested in light of their greater historical trends and local economic conditions. Diving deeper into the regional results, as well as the highest and lowest performing markets will expose how specific locations deviate substantially from the nation's more gradual stabilization.
National/Four Region Market Overview (Feb. 2010 - March 2011)
West Region Slows Flattening National Home Price Trend
- Nation returns third consecutive month of slowing quarter-over-quarter price declines.
- Despite national trend toward flattening of home prices, the West region continues price declines. Eight of the fifteen lowest performing markets are from the West.
- Driven by heavily distressed markets in Arizona and Nevada, the West region expected to set new double dip price lows as early as next month.
For the third consecutive monthly HDI Market Report, quarter-over-quarter home prices slowed their descent. This month's modest national -1.4 percent price change is a slight improvement over the -1.6 percent changes reported last month. Weak home prices persist in the West region, however, led by a -13.4 percent yearly price change in Tucson, AZ. Of the eight lowest performing markets from the West, five have REO saturation rates above 42 percent and more than half the homes sold in Las Vegas are bank owned.
As prices continue to slide, new record price lows for the West are only 0.7 percent away and could be realized as early as next month. This is notable, since two years have passed since the prior record price lows were seen in early 2009. While local variations persist, this leaves some recently vested investors in the West with little potential gain while broadly amplifying the risk of losses.
Metro Markets (Feb. 2010 - March 2011)
Mixed Results
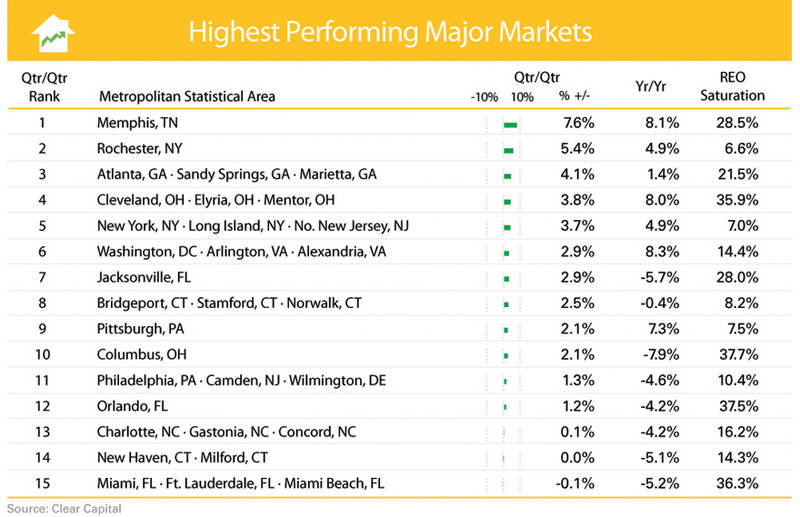
- Washington D.C. continues to see quarter-over-quarter improvement while maintaining longer term gains.
- Quarter-over-quarter prices continue to improve for all the highest performing markets except Pittsburgh, PA; Jacksonville, FL; and Cleveland, OH.
- The highest performing major markets continue solid quarter-over-quarter gains, with 12 of the 15 markets improving over last month's report, and only Miami, FL (-0.1%) experienced a negative price change.
Over the past two years, home prices in eight of the fifteen listed markets have seen values decline. Similarly, despite impressive price gains by percentage in a few of these markets, all of them remain firmly entrenched in negative territory compared to their market peaks. In the worst case, after falling 22.4 percent over the last two years, Orlando, FL home prices are just above lows last experienced in 1998.
These lows are book-ended by the two-year 81.7 percent price gain in the extremely low priced and hard hit Cleveland MSA. The magnitude of markets with price gains quickly abates. Memphis, TN, follows with a 20.8 percent gain over two years; followed by Pittsburgh, PA (15.2%); Washington D.C (13.2%); and Rochester, NY (12.2%) rounds out the top five highest performing markets over the past two years. As for Cleveland's leading two-year gains, it's critical to note that this market still remains 55.9 percent below its market peak.
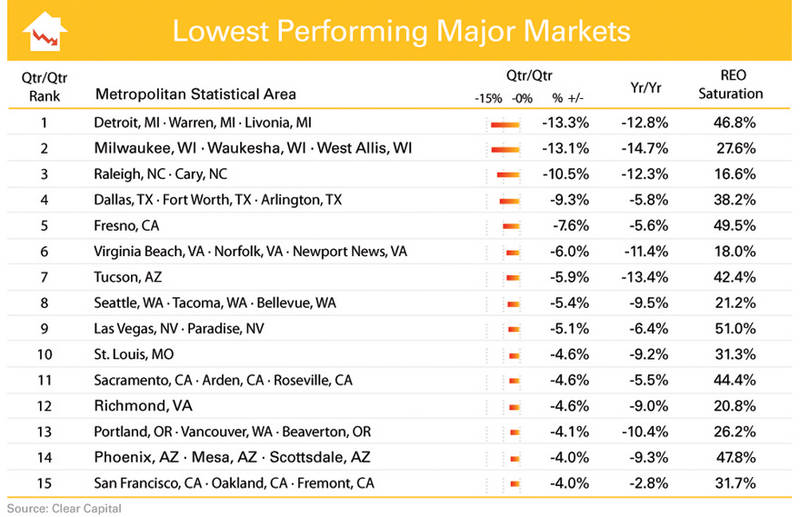
Lowest Performing Markets Drift Downward
- Struggling markets continue to see quarter-over-quarter prices erode.
- Two-thirds of the lowest performing markets experiencing year-over-year price changes greater than -9.0%.
- Richmond, VA; Phoenix, AZ; and San Francisco, CA were the only markets to see minor improvements in their quarter-over-quarter gains in this month's report compared to last month.
The lowest performing markets have experienced longer term losses. Only three markets among this set managed positive price gains over the last two years, while all fifteen have experienced year-over-year declines. Even the three markets posting the largest two-year gains, are diminished by the fact that the price gains constitute an abrupt and short-lived rebound in the latter half of 2009, which subsequently masks smaller but significant declines in 2010. The two-year gains within San Francisco, CA (9.2%); St. Louis, MO (6.6%); and Detroit, MI (6.6%). MSAs are quickly being eroded by losses (-2.8, -9.2 and -12.8) over the past twelve months, respectively.
Perhaps not as surprising, Las Vegas, NV (-22.2%); Tucson, AZ (-20.8%) and Phoenix, AZ (-17.1%) lead in terms of poorest price performance over the past two years. What might not be expected is that Seattle, WA (-16.9%) and Portland, OR (-14.6%) experienced the next poorest positions, largely a result of the approximately one year delay both these markets have experienced compared to the national cycle.
About the Clear Capital Home Data Index (HDI) Market Report
The Clear Capital HDI Market Report has displayed consistent market trends as other leading indices (peak, trough, secondary trough and tax credit run-ups). Despite these consistencies, a critical difference is that HDI's methodology enables more timely and granular reporting.
The Clear Capital HDI Market Report:
- Offers the real estate industry (investors, lenders and servicers), government agencies and the public insight into the most recent pricing conditions, not only at the national and metropolitan level, but within local markets as well.
- Data is built on the most recent information available from recorder/assessor offices, and then further enhanced by adding the company's proprietary streaming market data for the most comprehensive geographic coverage and local insights available.
- Reflects nationwide coverage of sales transactions and aggregates this comprehensive dataset at ten different geographic levels, including hundreds of metropolitan statistical areas (MSAs) and sub-ZIP code boundaries.
- Includes equally-weighted distressed bank owned sales (REOs) from around the country to give the most real world look of pricing dynamics across all sales types.
- Patent-pending rolling quarter technology allows for the most current market data by providing more frequent updates. This ensures decisions are based on the most up-to-date information available.
Clear Capital Home Data Index™ Methodology
- Generates the timeliest indices in patent pending rolling quarter intervals that compare the most recent four months to the previous three months. The rolling quarters have no fixed start date and can be used to generate indices as data flows in, significantly reducing the multi-month lag time experienced with other indices.
- Includes both fair market and institutional (real estate owned) transactions, giving equal weight to all market transactions and identifying price tiers at a market specific level. By giving equal weight to all transactions the HDI is truly representative of each unique market.
- An address-level cascade results in an index with the most granular, statistically significant market area available.
- Provides weighted repeat sales, and price-per-square-foot index models that use multiple sale types, including single-family homes, multi-family homes and condominiums.
About Clear Capital
Clear Capital (www.clearcapital.com) is a premium provider of data and solutions for real estate asset valuation and risk assessment for large financial services companies. Our products include appraisals, broker-price opinions, property condition inspections, value reconciliations, and home data indices. Clear Capital's combination of progressive technology, high caliber in-house staff and a well-trained network of more than 40,000 field experts sets a new standard for accurate, up-to-date and well documented valuation data and assessments. The Company's customers include the largest U.S. banks, investment firms and other financial organizations.
Legend
Address Level Cascade -- Provides the most granular market data available. From the subject property, progressively steps out from the smallest market to larger markets until data density and statistical confidence are sufficient to return a market trend.
Home Data Index (HDI) -- Powerful analytics tool that provides contextual data augmenting other, human-based valuation tools. Clear Capital's multi-model approach combines address-level accuracy with the most current proprietary home pricing data available.
Metropolitan Statistical Area (MSA) -- Geographic entities defined by the U.S. Office of Management and Budget (OMB) for use by Federal statistical agencies in collecting, tabulating, and publishing Federal statistics.
Repeat Sales Model -- Weighted linear model based on repeat sales of same property over time.
Price Per Square Foot (PPSF) Model -- Median price movement of sale prices divided by square footage over a period of time -- most commonly a quarter.
Real Estate Owned (REO) Saturation -- Calculates the percentage of REOs sold as compared to all properties sold in the last rolling quarter.
Rolling Quarters -- Patent pending rolling quarters compare the most recent four months to the previous three months.
The information contained in this report is based on sources that are deemed to be reliable; however no representation or warranty is made as to the accuracy, completeness, or fitness for any particular purpose of any information contained herein. This report is not intended as investment advice, and should not be viewed as any guarantee of value, condition, or other attribute.
Contact Information:
Media Contact:
Michelle Sabolich
Atomic PR for Clear Capital
415.593.1400