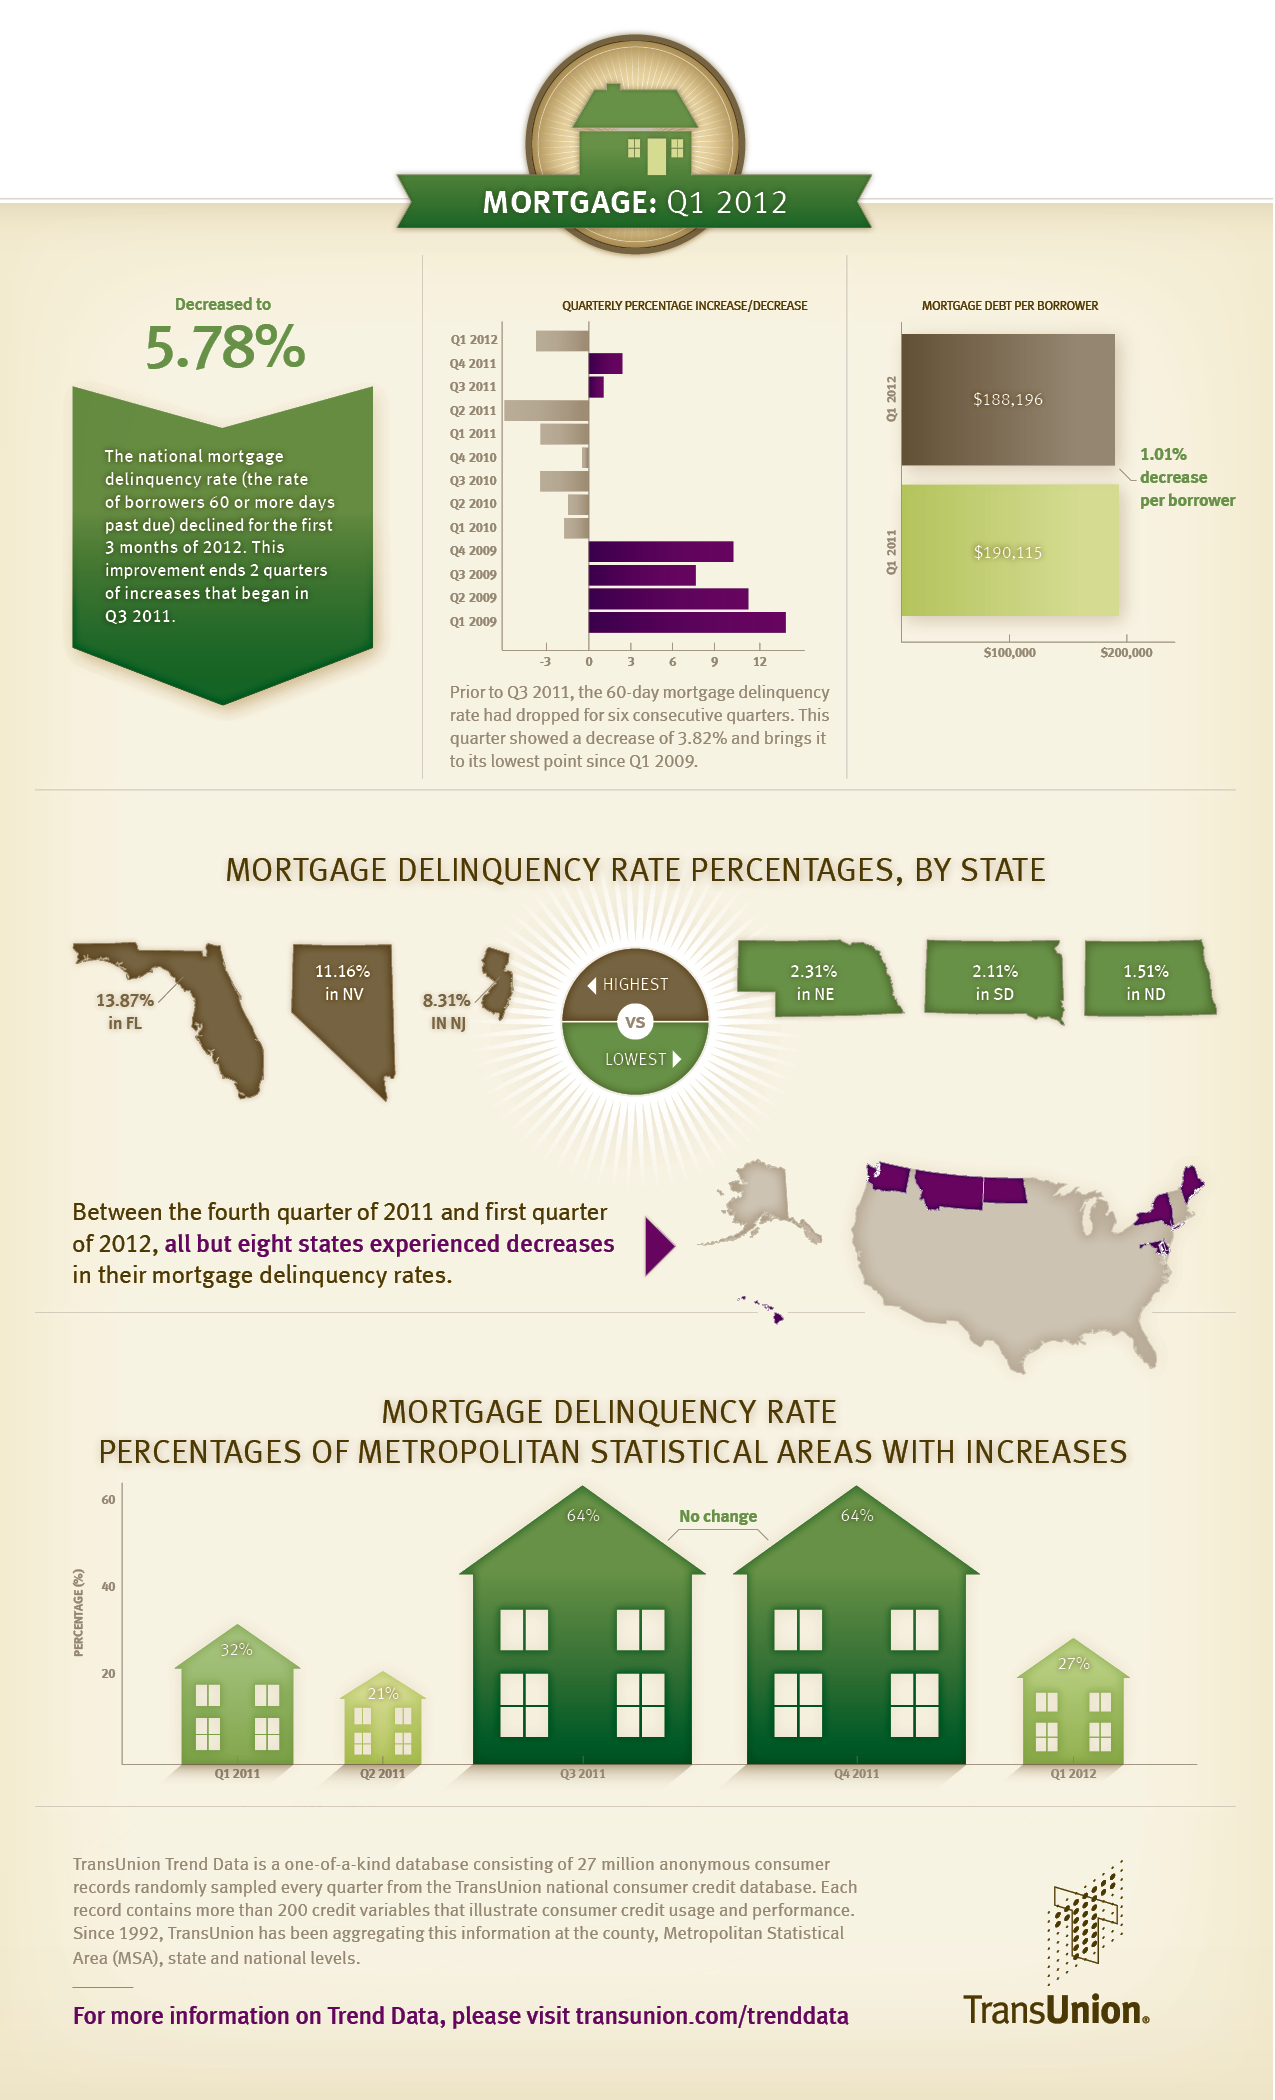
CHICAGO, IL--(Marketwire - May 9, 2012) - The national mortgage delinquency rate (the rate of borrowers 60 or more days past due) declined for the first 3 months of 2012, coming in at 5.78%. This improvement ends 2 quarters of increases that began in Q3 2011. This information is reported by TransUnion and is part of its ongoing series of quarterly analyses of credit-active U.S. consumers and how they are managing credit related to mortgages, credit cards and auto loans.
Prior to Q3 2011, 60-day mortgage delinquency rates had dropped for six consecutive quarters. This latest quarter brings the delinquency rate to its lowest point since Q1 2009.
Between fourth quarter 2011 and first quarter of 2012, all but eight states experienced decreases in their mortgage delinquency rates. On a more granular level, 73% of metropolitan areas saw improvement in their mortgage delinquency rates in Q1 2012. This is up from the prior two periods when only 36% of the MSAs experienced improvement.
"To see that quarter over quarter, and year over year, more homeowners were able to make their mortgage payments is certainly welcome news," said Tim Martin, group vice president of U.S. Housing in TransUnion's financial services business unit. "Before this, we saw two quarters of delinquency increases and while we are still about three-times above the pre-recession norm, this should mark the start of consistent improvement each quarter."
House prices continue to face downward pressure and unemployment remains high, but many see the economic environment beginning to show modest improvement. Therefore, TransUnion's forecast predicts mortgage delinquency rates to drift downward in 2012 as more homeowners are able to repay their mortgage debt obligations.
"We have seen increased traction of refinance activity related to HARP 2.0, a program that makes it easier for homeowners with negative equity in their home to refinance," said Martin. "Going forward, as these homeowners take advantage of the historic low mortgage interest rates, and perhaps lower their monthly payment in the process, it may have some positive impact on the overall delinquency rate starting later this year."
TransUnion's forecast is based on various economic assumptions, such as gross state product, consumer sentiment, unemployment rates, real personal income, and real estate values. The forecast would change if there are unanticipated shocks to the economy affecting recovery in the housing market or if home prices fall more than expected.
Q1 2012 Mortgage Statistics - Delinquency Rates
| Quarter over Quarter | Q4 2011 | Q1 2012 | Pct. Change | |||
| USA | 6.01% | 5.78% | (3.83%) | |||
| Year over year | Q1 2011 | Q1 2012 | Pct. Change | |||
| USA | 6.19% | 5.78% | (6.62%) | |||
| Highest Mortgage Delinquency States | Q1 2012 | |
| Florida | 13.87% | |
| Nevada | 11.16% | |
| New Jersey | 8.31% | |
| Maryland | 7.11% | |
| Lowest Mortgage Delinquency States | Q1 2012 | |
| North Dakota | 1.51% | |
| South Dakota | 2.11% | |
| Nebraska | 2.31% | |
| Wyoming | 2.43% | |
| Top 3 Year-over-Year Increases | Q1 2011 | Q1 2012 | Pct. Change | |||
| Vermont | 2.88% | 3.31% | 14.93% | |||
| New Jersey | 7.58% | 8.31% | 9.63% | |||
| Arkansas | 3.51% | 3.73% | 6.27% | |||
| Top 3 Year-over-Year Declines | Q1 2011 | Q1 2012 | Pct. Change | |||
| Arizona | 9.14% | 6.86% | (24.95%) | |||
| Wyoming | 3.16% | 2.43% | (23.10%) | |||
| California | 8.58% | 6.66% | (22.38%) | |||
Q4 2011 Mortgage Statistics - Mortgage Debt Per Borrower
| Quarter over Quarter | Q4 2011 | Q1 2012 | Pct. Change | |||
| USA | $188,194 | $188,196 | 0.00% | |||
| Year over Year | Q1 2011 | Q1 2012 | Pct. Change | |||
| USA | $190,115 | $188,196 | (1.01%) | |||
| Highest Mortgage Debt States | Q1 2012 | |
| District of Columbia | $378,732 | |
| California | $331,133 | |
| Hawaii | $312,324 | |
| Maryland | $248,878 | |
| Lowest Mortgage Debt States | Q1 2012 | |
| West Virginia | $101,473 | |
| Mississippi | $108,558 | |
| Oklahoma | $114,821 | |
| Arkansas | $115,782 | |
| Top 3 Year-over-Year Increases | Q1 2011 | Q1 2012 | Pct. Change | |||
| Alaska | $198,842 | $203,953 | 2.57% | |||
| Oklahoma | $112,197 | $114,821 | 2.34% | |||
| North Dakota | $117,874 | $120,321 | 2.08% | |||
| Top 3 Year-over-Year Declines | Q1 2011 | Q1 2012 | Pct. Change | |||
| Nevada | $229,457 | $215,312 | (6.16%) | |||
| Arizona | $202,931 | $196,303 | (3.27%) | |||
| Florida | $185,038 | $180,294 | (2.56%) | |||
Supporting Resources/Links
TransUnion Trend Data Interactive U.S. Map
TransUnion 4Q11 Mortgage Statistics
TransUnion Payment Hierarchy Study
TransUnion Life After Foreclosure Study
TransUnion on Twitter
TransUnion's Trend Data database
TransUnion's Trend Data is a one-of-a-kind database consisting of 27 million anonymous consumer records randomly sampled every quarter from TransUnion's national consumer credit database. Each record contains more than 200 credit variables that illustrate consumer credit usage and performance. Since 1992, TransUnion has been aggregating this information at the county, Metropolitan Statistical Area (MSA), state and national levels. For the purpose of this analysis, the term "credit card" refers to those issued by banks.
About TransUnion
As a global leader in information and risk management, TransUnion creates advantages for millions of people around the world by gathering, analyzing and delivering information. For businesses, TransUnion helps improve efficiency, manage risk, reduce costs and increase revenue by delivering high quality data, and integrating advanced analytics and enhanced decision-making capabilities. For consumers, TransUnion provides the tools, resources and education to help manage their credit health and achieve their financial goals. Through these and other efforts, TransUnion is working to build stronger economies worldwide. Founded in 1968 and headquartered in Chicago, TransUnion reaches businesses and consumers in 25 countries around the world. www.transunion.com/business
Contact Information:
Contact
Dave Blumberg
TransUnion
E-mail
Telephone (312) 985-3059