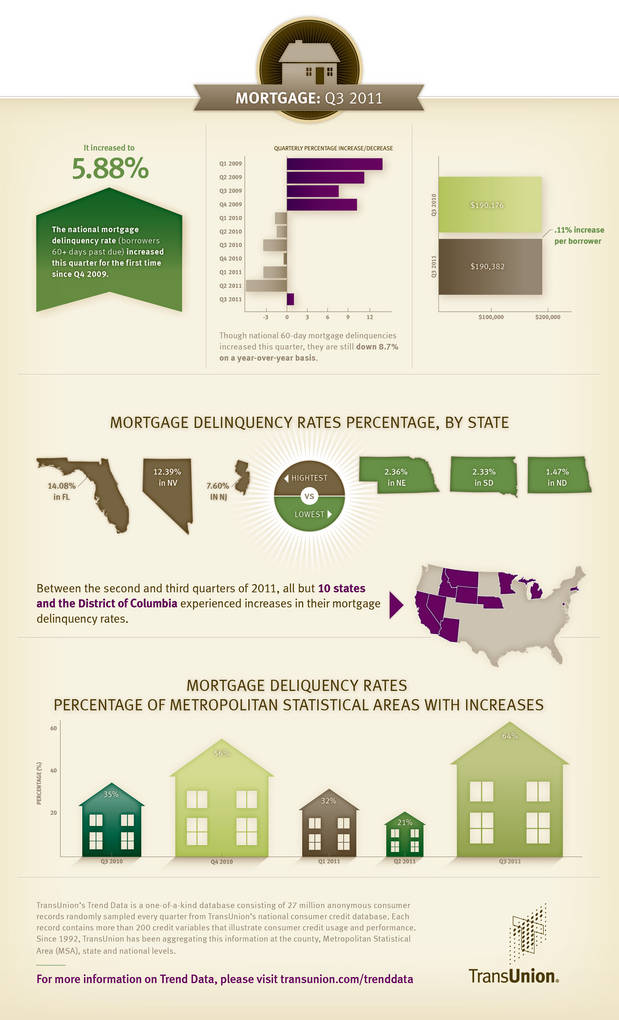
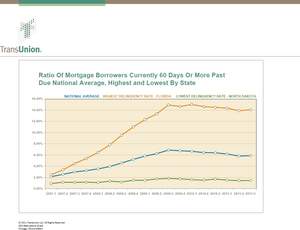
CHICAGO, IL--(Marketwire - Nov 8, 2011) - The national mortgage delinquency rate (the rate of borrowers 60 or more days past due) increased for the first time since the end of 2009, edging upward to 5.88% at the end of the third quarter in 2011. This information is reported by TransUnion and is part of its ongoing series of quarterly analyses of credit-active U.S. consumers and how they are managing credit related to mortgages, credit cards and auto loans.
"Until this quarter, we had seen six straight quarters where progressively more people were able to make their mortgage payments on time. We expected that trend to continue given recent, relatively more conservative lending policies and the apparent stabilization of both home values and unemployment," said Tim Martin, group vice president of U.S. Housing in TransUnion's financial services business unit. "However, in the third quarter, the consumer was hit with several unanticipated shocks, including the U.S. credit rating downgrade, stock price declines, European debt concerns, stubbornly high unemployment, more downward pressure on home values and low consumer confidence. All of this affects a borrower's net worth and desire, or ability, to continue making house payments -- especially if they are facing negative equity in their homes due to price depreciation."
Between the second and third quarters of 2011, all but 10 states and the District of Columbia experienced increases in their mortgage delinquency rates. On a more granular level, 64% of metropolitan areas saw increases in their mortgage delinquency rates in Q3 2011. This is a significant difference compared to Q2 2011 when only 21% of metropolitan statistical areas (MSA) experienced a rise. In Q1 2011, 32% of MSAs experienced an increase.
TransUnion's forecast predicts mortgage borrower delinquency rates to drift downward in 2012. However in the short run, we may see a quarter or two of slightly elevated nonpayment rates as some consumers are not able to, or decide not to, repay their mortgage debt obligations in light of the uncertain economic outlook.
TransUnion's forecast is based on various economic assumptions, such as gross state product, consumer sentiment, unemployment rates and real estate values. The forecast would change if there are unanticipated shocks to the economy affecting recovery in the housing market or if home prices fall more than expected.
Q3 2011 Mortgage Statistics - Delinquency Rates
| Quarter over Quarter |
|
Q2 2011 |
|
Q3 2011 |
|
Pct. Change |
| Year over year |
|
Q3 2010 |
|
Q3 2011 |
|
Pct. Change |
| USA |
|
6.44 |
% |
|
5.88 |
% |
|
(8.70 |
%) |
| Highest Mortgage Delinquency States |
|
Q3 2011 |
| Florida |
14.08 |
% |
| Nevada |
12.39 |
% |
| New Jersey |
7.60 |
% |
| Arizona |
7.46 |
% |
| Lowest Mortgage Delinquency States |
Q3 2011 |
| North Dakota |
1.47 |
% |
| South Dakota |
2.33 |
% |
| Nebraska |
2.36 |
% |
| Alaska |
2.78 |
% |
| Top 3 Year-over-Year Increases |
|
Q3 2010 |
|
Q3 2011 |
|
Pct. Change |
| Vermont |
|
2.76 |
% |
|
3.19 |
% |
|
15.58 |
% |
| New Jersey | |
7.07 |
% |
|
7.60 |
% |
|
7.50 |
% |
| Oklahoma |
|
4.10 |
% |
|
4.38 |
% |
|
6.83 |
% |
| Top 3 Year-over-Year Declines |
|
Q3 2010 |
|
Q3 2011 |
|
Pct. Change |
| Arizona |
9.96 |
% |
7.46 |
% |
(25.10 |
%) |
| California |
9.64 |
% |
7.29 |
% |
(24.38 |
%) |
| Utah |
5.44 |
% |
4.40 |
% |
(19.12 |
%) |
Q3 2011 Mortgage Statistics - Mortgage Debt Per Borrower
| Quarter over Quarter |
|
Q2 2011 |
|
Q3 2011 |
|
Pct. Change |
| USA |
|
$189,205.00 |
|
$190,382.00 |
|
0.62 |
% |
| Year over Year |
|
Q3 2010 |
|
Q3 2011 |
|
Pct. Change |
| USA |
|
$190,176.00 |
|
$190,382.00 |
|
0.11 |
% |
| Highest Mortgage Debt States |
Q3 2011 |
| District of Columbia |
$374,241.00 |
| California |
$339,546.00 |
| Hawaii |
$334,606.00 |
| Maryland |
$253,223.00 |
| Lowest Mortgage Debt States |
Q3 2011 |
| West Virginia |
$101,553.00 |
| Mississippi |
$109,370.00 |
| Oklahoma |
$113,617.00 |
| Arkansas |
$114,955.00 |
| Top 3 Year-over-Year Increases |
|
Q3 2010 |
|
Q3 2011 |
|
Pct. Change |
| Hawaii |
|
$309,536.00 |
|
$334,606.00 |
|
8.10% |
| South Dakota |
|
$129,659.00 |
|
$137,555.00 |
|
6.09% |
| North Dakota |
|
$113,006.00 |
|
$118,686.00 |
|
5.03% |
| Top 3 Year-over-Year Declines |
|
Q3 2010 |
|
Q3 2011 |
|
Pct. Change |
| Nevada |
|
$235,651.00 |
|
$223,813.00 |
|
(5.02 |
%) |
| Arizona |
|
$206,356.00 |
|
$200,411.00 |
|
(2.88 |
%) |
| Florida |
|
$187,303.00 |
|
$182,676.00 |
|
(2.47 |
%) |
Supporting Resources/Links
TransUnion Trend Data Interactive U.S. Map
TransUnion 2Q11 Mortgage Statistics
TransUnion Payment Hierarchy Study
TransUnion Deleveraging Analysis
TransUnion on Twitter
TransUnion's Trend Data database
TransUnion's Trend Data is a one-of-a-kind database consisting of 27 million anonymous consumer records randomly sampled every quarter from TransUnion's national consumer credit database. Each record contains more than 200 credit variables that illustrate consumer credit usage and performance. Since 1992, TransUnion has been aggregating this information at the county, Metropolitan Statistical Area (MSA), state and national levels. For the purpose of this analysis, the term "credit card" refers to those issued by banks.
About TransUnion
As a global leader in information and risk management, TransUnion creates advantages for millions of people around the world by gathering, analyzing and delivering information. For businesses, TransUnion helps improve efficiency, manage risk, reduce costs and increase revenue by delivering high quality data, and integrating advanced analytics and enhanced decision-making capabilities. For consumers, TransUnion provides the tools, resources and education to help manage their credit health and achieve their financial goals. Through these and other efforts, TransUnion is working to build stronger economies worldwide. Founded in 1968 and headquartered in Chicago, TransUnion reaches businesses and consumers in 23 countries around the world. www.transunion.com/business
Contact Information:
Contact
Dave Blumberg
TransUnion
E-mail
Telephone 312 972 6646