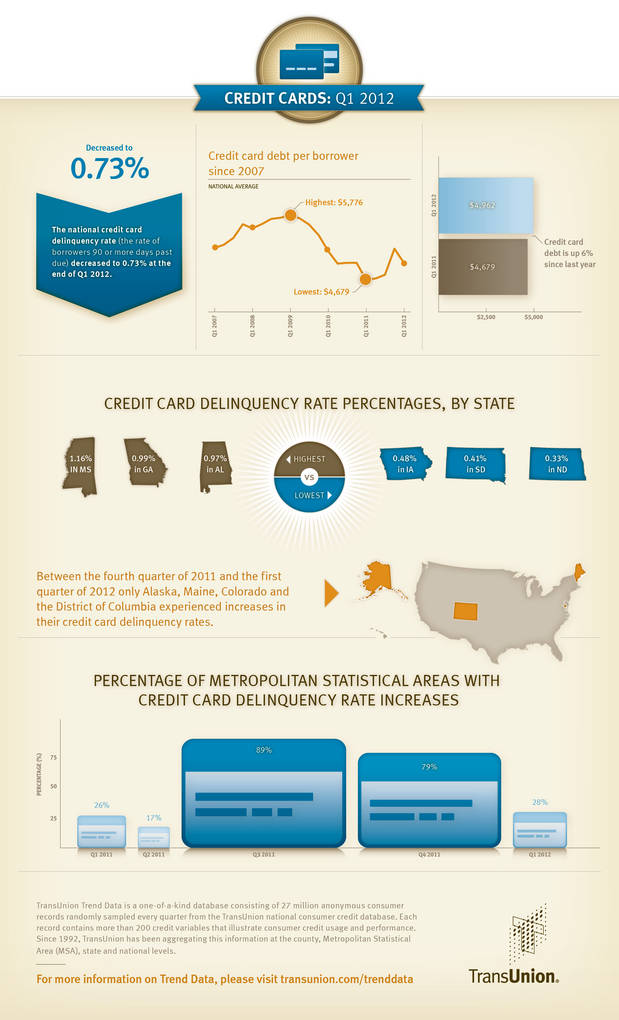
CHICAGO, IL--(Marketwire - May 16, 2012) - The national credit card delinquency rate (the rate of borrowers 90 or more days past due) dropped to 0.73% in Q1 2012 from 0.78% Q4 2011, with current levels well below historical norms. Average credit card debt per borrower decreased $242 from Q4 2011 to $4,962. These decreases reversed a negative trend that saw both the delinquency rate and average debt per borrower rise during the last six months of 2011.
Looking at the year-over-year trend, the national delinquency rate was essentially flat and average debt per borrower was $283 higher. This information is reported by TransUnion and is part of its ongoing series of quarterly analyses of credit-active U.S. consumers, evaluating how they are managing credit related to mortgages, credit cards and auto loans.
"After two consecutive quarters of increases in both the delinquency rate and average debt, it is encouraging to see a return to declines in delinquency," said Ezra Becker, vice president of research and consulting in TransUnion's financial services business unit. "This contributed positively to a general trend since the bottom of the recession, which saw delinquency rates remain at near-record lows. Trends in average debt year over year suggest that little more than the usual seasonal influence is behind these changes. Since we rarely see significant increases in either category at this time of the year, this movement isn't significant enough to suggest much more than a return to the status quo of early last year."
Total card originations in 2011 grew by over 20% relative to 2010. Moreover, in 2010 only 21.8% of new card originations went to consumers with a VantageScore® lower than 700 (on a scale of 501-990); in 2011, that number had risen to 24.2%. This trend continued into Q1 2012, as 24.1% of new card originations were to non-prime, higher-risk consumers.
"The influx of sub-prime lending we saw from previous quarters continued in Q1 2012, but demand for new card originations also picked up among prime and super-prime consumers," Becker said. "The good news is that increased lending, particularly to non-prime borrowers, hasn't affected delinquency rates, which have remained unchanged over the past year. Bank cards are one of the most important assets for consumers, and it is evident consumers have been working hard to stay current on their cards and to maintain access to this important financial tool."
In the first quarter of 2012, only three states and the District of Columbia saw increases in their credit card delinquency rates. On a more granular level, 28% of metropolitan statistical areas (MSAs) saw increases in their respective credit card delinquency rates in Q1 2012. This was down compared to last quarter, when 79% of MSAs experienced an increase.
"We continue to see improvements in high-risk states such as Arizona, California, Florida and Nevada," Becker said. "It is heartening to see this rebound in some of the states hit hardest by the recession."
While average credit card debt-per-borrower decreased $242 quarter over quarter, this decline can be attributed to normal seasonal fluctuations, as consumers charge holiday shopping purchases on their cards in the fourth quarter and pay them down in the first quarter through tax refunds and bonuses. However, on a year-over-year basis, average credit card debt-per-borrower increased 6.1%.
"This year-over-year increase in average card debt-per-borrower could be anticipated based on the strong growth in new card originations over the past year," said Becker. "This growth is an indication that consumers are more confident in the economic outlook and are more comfortable charging purchases on their cards. In addition, the increase in originations to non-prime consumers in 2011 and through the first quarter of 2012 may have made cards available to a group of consumers that previously had little access to revolving credit, and who are now using those new cards."
Based on current economic assumptions, TransUnion is maintaining previous forecasts for credit card delinquencies to remain near current levels, with potentially some seasonal fluctuations, through the end of 2012. This forecast is based on seasonality effects and various other economic factors such as anticipated gross state product, consumer sentiment, disposable income, and employment conditions. The forecast changes as the economy deviates from a conservative economic forecast, or if there are unanticipated shocks to the economy affecting recovery.
Q1 2012 Credit Card Statistics -- Delinquency Rates
| Quarter over Quarter | Q4 2011 | Q1 2012 | Pct. Change |
| USA | 0.78% | 0.73% | (6.41%) |
| Year over year | Q1 2011 | Q1 2012 | Pct. Change |
| USA | 0.74% | 0.73% | (1.35%) |
| Highest Credit Card Delinquency States | Q1 2012 |
| Mississippi | 1.16% |
| Georgia | 0.99% |
| Alabama | 0.97% |
| Arkansas | 0.97% |
| Lowest Credit Card Delinquency States | Q1 2012 |
| North Dakota | 0.33% |
| South Dakota | 0.41% |
| Iowa | 0.48% |
| Nebraska | 0.49% |
| Top 3 Year-over-Year Declines | Q1 2011 | Q1 2012 | Pct. Change |
| South Dakota | 0.53% | 0.41% | (22.64%) |
| Nevada | 1.16% | 0.93% | (19.83%) |
| Idaho | 0.79% | 0.66% | (16.46%) |
Q4 2011 Credit Card Statistics -- Credit Card Debt Per Borrower
| Quarter-over-Quarter | Q4 2011 | Q1 2012 | Pct. Change |
| USA | $5,204 | $4,962 | (4.65%) |
| Year-over-Year | Q1 2011 | Q1 2012 | Pct. Change |
| USA | $4,679 | $4,962 | 6.05% |
| Highest Credit Card Debt States | Q1 2012 |
| Alaska | $6,801 |
| Colorado | $5,729 |
| North Carolina | $5,626 |
| Connecticut | $5,501 |
| Lowest Credit Card Debt States | Q1 2012 |
| Iowa | $3,893 |
| North Dakota | $3,998 |
| West Virginia | $4,226 |
| South Dakota | $4,251 |
| Top 3 Year-over-Year Increases | Q1 2011 | Q1 2012 | Pct. Change |
| New Jersey | $4,895 | $5,470 | 11.75% |
| Vermont | $4,099 | $4,565 | 11.35% |
| District of Columbia | $4,654 | $5,179 | 11.28% |
| Top 3 Year-over-Year Declines | Q1 2011 | Q1 2012 | Pct. Change |
| Mississippi | $4,868 | $4,674 | (3.98%) |
| Hawaii | $5,303 | $5,093 | (3.97%) |
| Tennessee | $4,639 | $4,623 | (0.36%) |
Supporting Resources/Links
TransUnion Trend Data Interactive U.S. Map
TransUnion 4Q11 Credit Card Statistics
TransUnion Payment Hierarchy Study
TransUnion Life After Foreclosure Study
TransUnion Deleveraging Analysis
TransUnion on Twitter
TransUnion's Trend Data database
TransUnion's Trend Data is a one-of-a-kind database consisting of 27 million anonymous consumer records randomly sampled every quarter from TransUnion's national consumer credit database. Each record contains more than 200 credit variables that illustrate consumer credit usage and performance. Since 1992, TransUnion has been aggregating this information at the county, Metropolitan Statistical Area (MSA), state and national levels. For the purpose of this analysis, the term "credit card" refers to those issued by banks.
About TransUnion
As a global leader in information and risk management, TransUnion creates advantages for millions of people around the world by gathering, analyzing and delivering information. For businesses, TransUnion helps improve efficiency, manage risk, reduce costs and increase revenue by delivering high quality data, and integrating advanced analytics and enhanced decision-making capabilities. For consumers, TransUnion provides the tools, resources and education to help manage their credit health and achieve their financial goals. Through these and other efforts, TransUnion is working to build stronger economies worldwide. Founded in 1968 and headquartered in Chicago, TransUnion reaches businesses and consumers in 25 countries around the world. For more information, visit www.transunion.com.
Contact Information:
Contact:
Dave Blumberg
TransUnion
E-mail:
Telephone: 312 972 6646