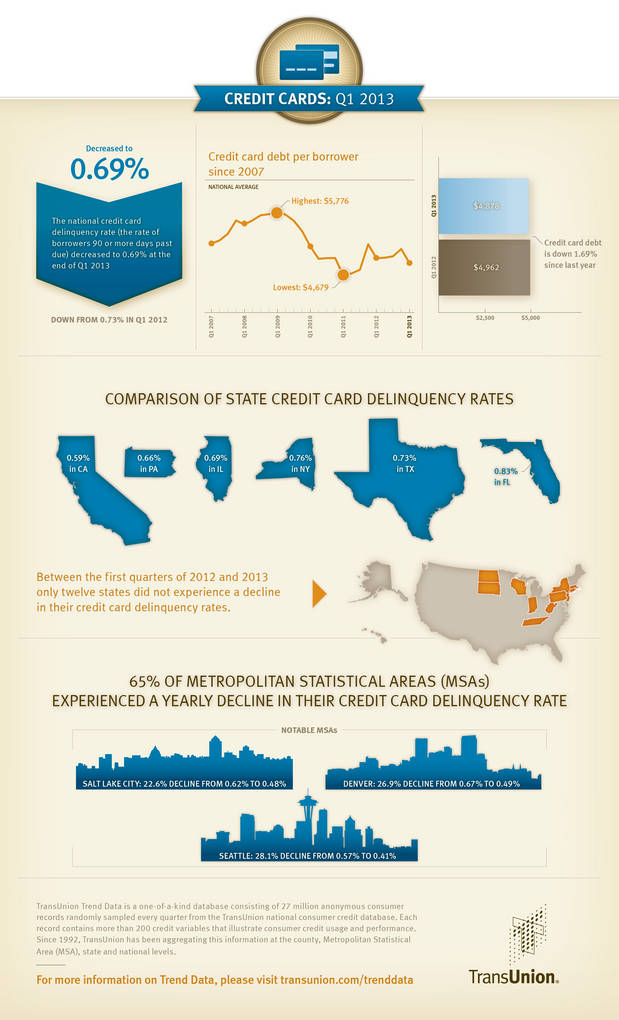
CHICAGO, IL--(Marketwired - May 21, 2013) - The national credit card delinquency rate (the ratio of borrowers 90 or more days past due) decreased to 0.69% in Q1 2013 from 0.73% in Q1 2012. The delinquency rate experienced a sharp 18.8% seasonal decline from the end of 2012, when it stood at 0.85%.
Average credit card debt per borrower also dropped 1.7% to $4,878 in Q1 2013 from $4,962 in Q1 2012. On a quarterly basis, card debt decreased 4.8% from $5,122 in Q4 2012.
This information is reported by TransUnion and is part of its ongoing series of quarterly analyses of credit-active U.S. consumers, evaluating how they are managing credit related to mortgages, credit cards and auto loans.
"We traditionally see credit card delinquencies and balances decline during the first three months of the year as many people pay down their holiday shopping balances or use their tax refunds to pay off their debts," said Ezra Becker, vice president of research and consulting in TransUnion's financial services business unit. "In addition to the seasonal quarter-over-quarter drop, the year-over year improvement in credit card delinquencies is indicative of how consumers continue to value their credit card relationships."
Since the beginning of the recession at the end of 2007, the credit card delinquency rate has declined five out of six times during the first quarter of the year on a quarterly basis. The average first quarter decline for this same timeframe has been 7.2%.
Only 12 states saw rises in their delinquency rates year over year, with Massachusetts and North Dakota the only ones to experience double-digit basis point increases -- and those from low starting points.
On a more granular level, 65% of metropolitan statistical areas (MSAs) saw declines in their respective delinquency rates in Q1 2013 relative to one year ago. This is significantly improved over the previous quarter, when only 33% of MSAs experienced year-over-year decreases. Some of the MSAs that experienced the largest year-over-year decreases in Q1 2012 included Seattle (28.1% decline from 0.57% to 0.41%), Denver (26.9% decline from 0.67% to 0.49%) and Salt Lake City (22.6% decline from 0.62% to 0.48%).
The TransUnion quarterly analysis of credit card performance also examines origination rates, which are evaluated one quarter in arrears to account for the reporting lag of new accounts. In Q4 2012, new credit card originations dropped 1.6% relative to Q4 2011 (from 7,695K to 7,570K accounts). The share of non-prime, higher-risk originations (with a VantageScore® 2.0 credit score lower than 700 on a scale of 501-990) was 28.14% in the Q4 2012, slightly below the same time one year ago (28.38% in Q4 2011), but higher than the 27.72% observed in Q4 2010.
"Though fourth quarter credit card originations had dropped compared to the prior year, the number of new credit cards entering the marketplace is still significantly greater than what we saw just a few years ago," explained Becker.
Based on current economic assumptions, TransUnion forecasts credit card delinquencies to increase slightly to approximately 0.71% in the second quarter of 2013. This forecast is based on seasonality effects and various other economic factors such as anticipated gross state product, consumer sentiment, disposable income, and employment conditions. The forecast changes as the economy deviates from a conservative economic forecast, if there are unanticipated shocks to the economy affecting recovery, or if lenders materially change their underwriting standards.
Q1 2013 Credit Card Statistics - Delinquency Rates
| Quarter over Quarter | Q4 2012 | Q1 2013 | Pct. Change |
| USA | 0.85% | 0.69% | (18.82%) |
| Year over year | Q1 2012 | Q1 2013 | Pct. Change |
| USA | 0.73% | 0.69% | (5.48%) |
| Highest Credit Card Delinquency States | Q1 2013 |
| Mississippi | 1.11% |
| Alabama | 0.94% |
| Arkansas | 0.89% |
| Georgia | 0.87% |
| Lowest Credit Card Delinquency States | Q1 2013 |
| South Dakota | 0.43% |
| North Dakota | 0.43% |
| Montana | 0.43% |
| Minnesota | 0.44% |
| Top 3 Year-over-Year Increases | Q1 2012 | Q1 2013 | Pct. Change |
| North Dakota | 0.33% | 0.43% | 30.30% |
| Massachusetts | 0.62% | 0.73% | 17.74% |
| Wisconsin | 0.52% | 0.57% | 9.62% |
| Top 3 Year-over-Year Declines | Q1 2012 | Q1 2013 | Pct. Change |
| Colorado | 0.68% | 0.52% | (23.53%) |
| Washington | 0.60% | 0.46% | (23.33%) |
| Oregon | 0.62% | 0.49% | (20.97%) |
Q1 2013 Credit Card Statistics - Credit Card Debt Per Borrower
| Quarter-over-Quarter | Q4 2012 | Q1 2013 | Pct. Change |
| USA | $5,122 | $4,878 | (4.75%) |
| Year-over-Year | Q1 2012 | Q1 2013 | Pct. Change |
| USA | $4,962 | $4,878 | (1.69%) |
| Highest Credit Card Debt States | Q1 2013 |
| Alaska | $6,789 |
| Colorado | $5,525 |
| North Carolina | $5,499 |
| Connecticut | $5,498 |
| Lowest Credit Card Debt States | Q1 2013 |
| Iowa | $3,810 |
| North Dakota | $3,987 |
| South Dakota | $4,038 |
| Wisconsin | $4,189 |
| Top 3 Year-over-Year Increases | Q1 2012 | Q1 2013 | Pct. Change |
| District of Columbia | $5,179 | $5,306 | 2.46% |
| Rhode Island | $4,968 | $5,031 | 1.27% |
| Vermont | $4,565 | $4,584 | 0.42% |
| Top 3 Year-over-Year Declines | Q1 2012 | Q1 2013 | Pct. Change |
| Nevada | $5,019 | $4,758 | (5.21%) |
| South Dakota | $4,251 | $4,038 | (5.00%) |
| Oregon | $4,887 | $4,676 | (4.31%) |
Supporting Resources/Links
TransUnion Trend Data Interactive U.S. Map
TransUnion 4Q12 Credit Card Statistics
TransUnion Credit Monitoring Study
TransUnion Payment Hierarchy Study
TransUnion Deleveraging Analysis
TransUnion on Twitter
TransUnion's Trend Data database
TransUnion's Trend Data is a one-of-a-kind database consisting of 27 million anonymous consumer records randomly sampled every quarter from TransUnion's national consumer credit database. Each record contains more than 200 credit variables that illustrate consumer credit usage and performance. Since 1992, TransUnion has been aggregating this information at the county, Metropolitan Statistical Area (MSA), state and national levels. For the purpose of this analysis, the term "credit card" refers to those issued by banks.
About TransUnion
As a global leader in information and risk management, TransUnion creates advantages for millions of people around the world by gathering, analyzing and delivering information. For businesses, TransUnion helps improve efficiency, manage risk, reduce costs and increase revenue by delivering high quality data, and integrating advanced analytics and enhanced decision-making capabilities. For consumers, TransUnion provides the tools, resources and education to help manage their credit health and achieve their financial goals. Through these and other efforts, TransUnion is working to build stronger economies worldwide. Founded in 1968 and headquartered in Chicago, TransUnion reaches businesses and consumers in 33 countries around the world on five continents. www.transunion.com/business
Contact Information:
Contact
Dave Blumberg
TransUnion
E-mail
Telephone 312 985 3059