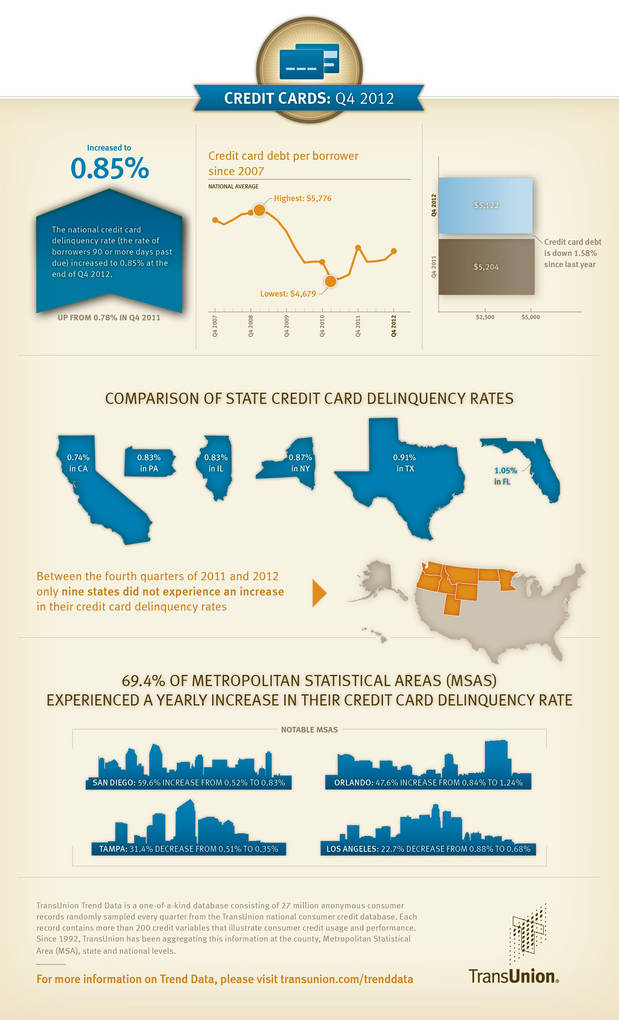
CHICAGO, IL--(Marketwire - Feb 20, 2013) - The national credit card delinquency rate (the ratio of borrowers 90 or more days past due) increased to 0.85% in Q4 2012 from 0.78% in Q4 2011. The delinquency rate is also up from the third quarter, when it stood at 0.75%.
Average credit card debt per borrower has dropped 1.6% to $5,122 in Q4 2012 from $5,204 in Q4 2011. On a quarterly basis, card debt rose 2.5% from $4,966 in Q3 2012.
This information is reported by TransUnion and is part of its ongoing series of quarterly analyses of credit-active U.S. consumers, evaluating how they are managing credit related to mortgages, credit cards and auto loans.
"The fourth quarter traditionally results in higher credit card balances and delinquencies, much of it to do with the holiday shopping season," said Ezra Becker, vice president of research and consulting in TransUnion's financial services business unit. "Though serious delinquencies have risen seven basis points in the last year, average credit card debt has actually dropped, which is a sign that consumers continue to manage their credit well. Both credit card delinquencies and balances are below historic norms."
In the last 10 years, the average national 90-day delinquency rate for the nation during the fourth quarter is 1.06%, while the average credit card debt per borrower is $5,389. In that same timeframe during the fourth quarter, delinquencies were at their highest in Q4 2003 (1.42%) and credit card debt peaked in Q4 2009 ($5,729).
"Consumers continue to value their credit card relationships and are diligent about paying off their balances in a timely fashion," said Becker. "This is a positive sign as more and more subprime borrowers have either entered or re-entered the credit card market."
The TransUnion quarterly analysis of credit card performance also examines origination rates, which are analyzed one quarter in arrears to account for the reporting lag of new accounts. In Q3 2012, new credit card originations dropped 2.4% relative to Q3 2011. The share of non-prime, higher-risk originations (with a VantageScore® credit score lower than 700 on a scale of 501-990) was 30.51% in the third quarter of the year, slightly below the same time one year ago (30.63% in Q3 2011), but much higher than the 27.03% observed in Q3 2010. "It's not surprising that originations dropped in 2012 relative to 2011, as solicitation volumes from the largest issuers decreased materially over that timeframe," explained Becker.
Thirty-nine states and the District of Columbia saw increases in their credit card delinquency rates year over year, while nine states saw decreases. Two states experienced no material changes.
On a more granular level, 67% of metropolitan statistical areas (MSAs) saw increases in their respective credit card delinquency rates in Q4 2012 relative to one year ago. This is only slightly higher than last quarter, when 64% of MSAs experienced year-over-year increases. Some of the largest MSAs to experience year-over-year increases in Q4 2012 included San Diego (59.6% increase from 0.52% to 0.83%), and Orlando (47.6% increase 0.84% to 1.24%). MSAs experiencing significant declines included Tampa (31.4% decrease from 0.51% to 0.35%) and Los Angeles (22.7% decrease 0.88% to 0.68%).
Based on current economic assumptions, TransUnion forecasts credit card delinquencies to slightly decrease to approximately 0.81% in the first quarter of 2013. This forecast is based on seasonality effects and various other economic factors such as anticipated gross state product, consumer sentiment, disposable income, and employment conditions. The forecast changes as the economy deviates from a conservative economic forecast, if there are unanticipated shocks to the economy affecting recovery, or if lenders materially change their underwriting standards.
Q4 2012 Credit Card Statistics - Delinquency Rates
| Quarter over Quarter | Q3 2012 | Q4 2012 | Pct. Change | |||
| USA | 0.75% | 0.85% | 13.33% | |||
| Year over year | Q4 2011 | Q4 2012 | Pct. Change | |||
| USA | 0.78% | 0.85% | 8.97% | |||
| Highest Credit Card Delinquency States | Q4 2012 |
| Mississippi | 1.41% |
| Alabama | 1.16% |
| Georgia | 1.12% |
| Nevada | 1.12% |
| Lowest Credit Card Delinquency States | Q4 2012 | |
| North Dakota | 0.41% | |
| Montana | 0.53% | |
| Minnesota | 0.54% | |
| Utah | 0.57% | |
| Top 3 Year-over-Year Increases | Q4 2011 | Q4 2012 | Pct. Change | |||
| Alaska | 0.41% | 0.63% | 53.66% | |||
| Massachusetts | 0.67% | 0.87% | 29.85% | |||
| New Hampshire | 0.67% | 0.83% | 23.88% | |||
| Top 3 Year-over-Year Declines | Q4 2011 | Q4 2012 | Pct. Change | |||
| Oregon | 0.69% | 0.60% | (13.04%) | |||
| Idaho | 0.78% | 0.70% | (10.26%) | |||
| Montana | 0.58% | 0.53% | (8.62%) | |||
Q4 2012 Credit Card Statistics - Credit Card Debt Per Borrower
| Quarter-over-Quarter | Q3 2012 | Q4 2012 | Pct. Change | |||
| USA | $4,996 | $5,122 | 2.53% | |||
| Year-over-Year | Q4 2011 | Q4 2012 | Pct. Change | |||
| USA | $5,204 | $5,122 | (1.58%) | |||
| Highest Credit Card Debt States | Q4 2012 | |
| Alaska | $7,012 | |
| Connecticut | $5,820 | |
| Colorado | $5,792 | |
| North Carolina | $5,748 | |
| Lowest Credit Card Debt States | Q4 2012 | |
| Iowa | $4,048 | |
| North Dakota | $4,179 | |
| South Dakota | $4,303 | |
| West Virginia | $4,412 | |
| Top 3 Year-over-Year Increases | Q4 2011 | Q4 2012 | Pct. Change | |||
| District of Columbia | $5,530 | $5,634 | 1.87% | |||
| Rhode Island | $5,173 | $5,226 | 1.01% | |||
| Delaware | $5,463 | $5,498 | 0.64% | |||
| Top 3 Year-over-Year Declines | Q4 2011 | Q4 2012 | Pct. Change | |||
| Idaho | $4,910 | $4,626 | (5.78%) | |||
| Colorado | $6,110 | $5,792 | (5.21%) | |||
| Wyoming | $5,060 | $4,859 | (3.99%) | |||
Supporting Resources/Links
TransUnion Trend Data Interactive U.S. Map
TransUnion 3Q12 Credit Card Statistics
TransUnion Credit Monitoring Study
TransUnion Payment Hierarchy Study
TransUnion Deleveraging Analysis
TransUnion on Twitter
TransUnion's Trend Data database
TransUnion's Trend Data is a one-of-a-kind database consisting of 27 million anonymous consumer records randomly sampled every quarter from TransUnion's national consumer credit database. Each record contains more than 200 credit variables that illustrate consumer credit usage and performance. Since 1992, TransUnion has been aggregating this information at the county, Metropolitan Statistical Area (MSA), state and national levels. For the purpose of this analysis, the term "credit card" refers to those issued by banks.
About TransUnion
As a global leader in information and risk management, TransUnion creates advantages for millions of people around the world by gathering, analyzing and delivering information. For businesses, TransUnion helps improve efficiency, manage risk, reduce costs and increase revenue by delivering high quality data, and integrating advanced analytics and enhanced decision-making capabilities. For consumers, TransUnion provides the tools, resources and education to help manage their credit health and achieve their financial goals. Through these and other efforts, TransUnion is working to build stronger economies worldwide. Founded in 1968 and headquartered in Chicago, TransUnion reaches businesses and consumers in 33 countries around the world on five continents. www.transunion.com/business
Contact Information:
Contact
Dave Blumberg
TransUnion
E-mail
Telephone 312 985 3059