NORFOLK, NE--(Marketwire - Mar 20, 2013) - Supertel Hospitality, Inc. (
2012 Fourth Quarter and Full-Year Highlights
- Received $30 million in new equity in February 2012.
- Replaced a $28.2 million loan with a new $30.6 million five year borrowing.
- Increased revenues from continuing operations to $16.4 million in the fourth quarter and $70.6 million for the full year.
- RevPAR for the same store hotels increased 1.9 percent for the year, but was flat for the fourth quarter.
- Net loss declined 41.5 percent and 22.1 percent for the year and quarter.
- Recorded $17.1 million Adjusted EBITDA for the full year and $2.66 million for the fourth quarter.
- Posted $(1.8) million Adjusted FFO for the full year and $(6.5) million in the fourth quarter.
- Sold 15 non-core hotels in 2012.
- Acquired 100-room Hilton Garden Inn for $11.5 million.
Fourth Quarter Operating & Financial Results
Revenues from continuing operations for the 2012 fourth quarter rose 5.2 percent, or $0.8 million, to $16.4 million, compared to the same year-ago period. The improvement was led by results from the recently acquired Hilton Garden Inn and a 1.5 percent increase in same store operations ADR.
Supertel had a 2012 fourth quarter net loss available to common shareholders of $(7.3) million, $(0.31) per diluted share, compared to $(8.6) million, or $(0.37) per diluted share, for the same 2011 period. The 2012 fourth quarter loss includes a $6.3 million tax valuation allowance, as well as a $1.9 million, non-cash impairment charge taken against assets classified as discontinued operations, offset by a $2.0 million gain on sale of assets. For the full year, the company had $10.2 million in non-cash impairment charges, compared to $14.3 million in non-cash impairment charges for full-year 2011.
Funds from operations (FFO) was $(5.2) million for the 2012 fourth quarter, compared to $0.2 million in the same 2011 period. Adjusted funds from operations (AFFO), which is FFO adjusted to exclude gains and losses on derivative liabilities and acquisition costs added back, in the 2012 fourth quarter was $(6.5) million, compared to $0.3 million in the same 2011 period. The decrease is primarily a result of the tax valuation allowance expense of $6.3 million.
Earnings before interest, taxes, depreciation and amortization (EBITDA) increased to $3.2 million from $(4.0) million for the 2012 fourth quarter. Adjusted EBITDA, which is EBITDA before non controlling interest, net gain/loss on disposition of assets, impairment, preferred stock dividends, unrealized gain/loss on derivatives and acquisition expense, declined to $2.7 million, compared to $3.0 million for the 2011 fourth quarter.
In the 2012 fourth quarter, the 63-hotel, same store portfolio reported essentially flat revenue per available room (RevPAR) of $30.09, a mix of a 1.5 percent improvement in ADR to $50.93, offset by a 1.5 percent decline in occupancy to 59.1 percent, compared to the 2011 fourth quarter. Supertel's portfolio outperformed the industry in occupancy by 2.5 percentage points.
"We made steady progress in executing our business strategy in 2012 by divesting 15 non-core assets, refinancing a total of $31.5 million of debt and acquiring our first upscale, limited-service hotel," said Kelly Walters, Supertel's president and chief executive officer. "Our results were impacted by the tax valuation allowance, but we believe that our strategy has the company headed in the proper direction. Still, much work remains to be done."
| Fourth Quarter 2012 vs Fourth Quarter 2011 | |||||||||||||||||
| Occ % | ADR ($) | RevPAR ($) | |||||||||||||||
| 2012 | 2011 | Var | 2012 | 2011 | Var | 2012 | 2011 | Var | |||||||||
| Industry - Total US Market | 56.6% | 55.3% | 2.4% | 106.54 | 102.40 | 4.0% | 60.34 | 56.64 | 6.5% | ||||||||
| Supertel - Same Store 63 hotels (1) | 59.1% | 60.0% | -1.5% | 50.93 | 50.18 | 1.5% | 30.09 | 30.09 | 0.0% | ||||||||
| Chain Scale (2) | |||||||||||||||||
| Industry - Upper Midscale | 57.6% | 56.2% | 2.6% | 95.89 | 92.54 | 3.6% | 55.28 | 52.00 | 6.3% | ||||||||
| Supertel - Upper Midscale 19 hotels | 59.0% | 60.1% | -1.8% | 71.14 | 70.76 | 0.5% | 41.97 | 42.56 | -1.4% | ||||||||
| Industry - Midscale | 49.6% | 48.4% | 2.6% | 72.47 | 70.13 | 3.3% | 35.96 | 33.91 | 6.0% | ||||||||
| Supertel - Midscale 3 hotels | 44.6% | 43.9% | 1.6% | 63.07 | 62.80 | 0.4% | 28.14 | 27.55 | 2.1% | ||||||||
| Industry - Economy | 49.8% | 49.1% | 1.4% | 51.45 | 49.38 | 4.2% | 25.63 | 24.24 | 5.7% | ||||||||
| Supertel - Economy 34 hotels | 57.0% | 57.8% | -1.4% | 51.20 | 50.35 | 1.7% | 29.18 | 29.09 | 0.3% | ||||||||
| Industry - Extended Stay | n/a | n/a | n/a | n/a | n/a | n/a | n/a | n/a | n/a | ||||||||
| Supertel - Extended Stay 7 hotels | 66.7% | 67.9% | -1.8% | 24.94 | 23.87 | 4.5% | 16.65 | 16.20 | 2.8% | ||||||||
| Industry Source: STR Monthly Review | |||||||||||||||||
| (1) | The comparisons for same store operations are for 63 hotels in continuing operations as of December 31, 2012. Comparative operating results for the Hilton Garden Inn, which was acquired in the 2012 second quarter, are not reflected in the 63 same-store hotel operating results shown above. | |
| (2) | Supertel's chain scale classifications are as follows: Upper midscale hotel brands currently in the company's portfolio include Comfort Inns, Comfort Suites, and Hampton Inn; Midscale brands include Quality Inn, Sleep Inn and Baymont Inn; Economy brands include Days Inn, Super 8, Key West Inns and Guesthouse Inn; Extended stay brands include the Savannah Suites. | |
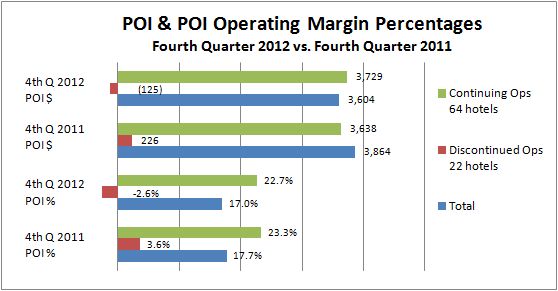
Property operating income (POI), an important operating measurement, is the revenue from room rentals and other hotel services less hotel and property operating expenses. For the 2012 fourth quarter, POI from continuing operations rose to $3.7 million, a 2.5 percent improvement, compared to $3.6 million for the same period a year earlier. POI from continuing operations for the full year increased 9.8 percent to $18.7 million.
See attached chart Property Operating Income (POI) and POI Operating Margin Percentage.
"Operationally, our hotels continue to benefit from our multiple operator strategy. We believe this strategy has generated stronger returns than our previous operational model. Many of our hotels are in the Midwest and in smaller towns which have not rebounded as quickly as larger urban markets," Walters said. "We are pleased with the margin improvements, but we are not satisfied yet with our profitability."
Full-Year Financial Results
Revenues from continuing operations for full-year 2012 increased 5.3 percent to $70.6 million.
Net loss attributable to common shareholders for 2012 was $(13.4) million, or $(0.58) per diluted share, compared with a 2011 net loss attributable to common shareholders of $(18.9) million, or $(0.82) per diluted share for the same 2011 period.
FFO for the full year 2012 was $(2.3) million, compared to $3.9 million for the same 2011 period. The company's Adjusted FFO for 2012 was $(1.8) million, compared to the $4.1 million reported at December 31, 2011. The lower results were impacted by the tax valuation allowance.
The portfolio of 63 same store hotels in 2012, compared with the same period a year earlier, reported a 1.9 percent rise in RevPAR as a result of a 2.4 percent increase in ADR, partially offset by a 0.5 percent decline in occupancy.
"Our operating results, with the exception of the West South Central region, enjoyed a combined 2.6 percent increase in RevPAR growth in 2012," said Walters. "This was offset by a 15.7 percent RevPAR decrease in the West South Central region due to increased business in 2011 which was a result of higher occupancy from the energy production industry."
For full-year 2012, the company recorded $10.2 million of impairment charges, including $6.4 million against discontinued operations hotels and $3.8 million against continuing operations properties.
Earnings before interest, taxes, depreciation and amortization, non controlling interest and preferred stock dividends (Adjusted EBITDA) was up 6.7 percent to $17.1 million for the full year 2012.
Acquisition Activity
In May 2012, the company acquired the 100-room Hilton Garden Inn in Dowell, (Solomons Island) Md. for $11.5 million, excluding closing costs and fees. This is the first acquisition as part of the company's new growth strategy.
Disposition Program
During 2012 the company sold 15 hotels for $25.5 million, resulting in a gain on sale of approximately $7.9 million. Proceeds were used primarily to improve the balance sheet by reducing debt and materially lowering debt service. The sold properties included:
Super 8: Fayetteville, AR; Muscatine, IA; El Dorado, KS; Sedalia, MO; Wichita, KS; Watertown, SD; Antigo, WI; Clinton, IA; Omaha (Aksarben), NE; Lincoln (West "O"), NE
Masters Inn: Tampa (Fairgrounds), FL
Comfort Inn: Erlanger, KY
Comfort Suites: Dover, DE
Guesthouse Inn: Jackson, TN
Ramada Inn: Ellenton, FL
The company currently is actively marketing 22 hotels for sale and expects to generate approximately $32.7 million in gross proceeds. "We have concentrated our efforts on disposing of assets that were the least profitable to us or were losing money and thus classified as non-core," Walters said.
Capital Reinvestment
During 2012, the company invested $5.7 million to upgrade its properties and maintain brand standards. "We expect to invest $8.0 million in improvements for our continuing operations hotels in 2013," Walters added. "The higher investment reflects our plan to maintain our core hotels in competitive physical condition to earn higher returns by generating stronger RevPAR performance."
Balance Sheet
The company continued to improve its balance sheet strength and flexibility in 2012 through mortgage debt reduction, loan-term extensions, covenant modifications and obtaining new equity and debt.
In November 2012, the company paid down a maturing $28.2 million loan with Greenwich Capital, replacing it with a $30.6 million loan originated by Morgan Stanley Capital Holdings. The new loan matures in 2017 and carries a 5.83 percent annual interest rate, 167 basis points lower than the previous loan, resulting in a reduction of approximately $1.1 million in annual debt service.
As of December 31, 2012, Supertel had $112.4 million in outstanding debt on its continuing operations hotels with an average term of 3.7 years and weighted average annual interest rate of 6.0 percent.
Subsequent Events
On January 21, 2013, Patrick Beans joined the company as senior vice president and treasurer, replacing David Walter, former senior vice president and treasurer, who retired in February 2013.
Following the close of the 2012 fourth quarter, the company sold two economy hotels, the Ellenton, Florida, Guesthouse Inn and Fredericksburg North, Virginia, Days Inn. Combined net proceeds totaled $3.31 million. The associated mortgage debt was fully retired with excess proceeds used for general corporate purposes.
Dividends
The company did not declare a dividend on common stock in 2012. Preferred dividends continued uninterrupted. The board of directors will continue to monitor the dividend policy on a quarterly basis.
Non-Cash Valuation Allowance Against Deferred Tax Assets
During its annual fourth quarter review of its deferred tax assets/liabilities for recoverability, the company determined that the probability of recovering a portion or all of its deferred tax assets did not meet the appropriate threshold and recorded a non-cash $6.3 million valuation allowance.
The company has not recorded taxable income in the Taxable REIT Subsidiary (TRS) in any of the past four years. Even though the 2012 TRS tax loss was significantly less than the three prior years, the company determined that as the loss years continue, the recoverability of those tax assets becomes less certain. The company believes that its growth strategies will make these tax assets recoverable, following future equity raises and acquisitions. However, until these strategies are successfully executed, they cannot be assured to provide sufficient taxable income to recover the deferred tax assets.
Outlook 2013
"We continue to reinvent Supertel by divesting of our non-core hotels on a planned basis, retaining those properties with the best long-term potential that are projected to meet our return criteria," Walters said.
"Our balance sheet is stronger," Walters continued. "We have paid down nearly $70 million in debt in the past four years and reduced our interest expense by more than 27 percent over the same period.
"Our business strategy calls for upgrading our portfolio to focus on hotels in the upscale and upper midscale, select-service segment," he noted. "The acquisition made last year, a Hilton Garden Inn, is typical of the type of properties we seek. We intend to accelerate our growth plan as capital markets and acquisition opportunities allow over the near and long term."
About Supertel Hospitality, Inc.
Supertel Hospitality, Inc. (
Forward Looking Statement
Certain matters within this press release are discussed using forward-looking language as specified in the Private Securities Litigation Reform Act of 1995, and, as such, may involve known and unknown risks, uncertainties and other factors that may cause the actual results or performance to differ from those projected in the forward-looking statement. These risks are discussed in the Company's filings with the Securities and Exchange Commission.
| SELECTED FINANCIAL DATA: |
| Supertel Hospitality, Inc. |
| Balance Sheet |
| As of December 31, 2012, and December 31, 2011 |
| (Dollars in thousands, except share and per share data) |
The company owned 86 hotels (including 22 hotels in discontinued operations) at December 31, 2012, and 100 hotels as of December 31, 2011, respectively.
| As of | ||||||||||
| December 31, | December 31, | |||||||||
| 2012 | 2011 | |||||||||
| ASSETS | ||||||||||
| Investments in hotel properties | $ | 236,992 | $ | 227,744 | ||||||
| Less accumulated depreciation | 73,665 | 69,097 | ||||||||
| 163,327 | 158,647 | |||||||||
| Cash and cash equivalents | 891 | 279 | ||||||||
| Accounts receivable, net of allowance for doubtful accounts of $201 and $194 | 2,070 | 1,891 | ||||||||
| Prepaid expenses and other assets | 5,151 | 8,917 | ||||||||
| Deferred financing costs, net | 2,644 | 850 | ||||||||
| Investment in hotel properties, held for sale, net | 27,764 | 50,588 | ||||||||
| $ | 201,847 | $ | 221,172 | |||||||
| LIABILITIES AND EQUITY | ||||||||||
| LIABILITIES | ||||||||||
| Accounts payable, accrued expenses and other liabilities | $ | 8,778 | $ | 10,704 | ||||||
| Derivative liablilites, at fair value | 15,935 | - | ||||||||
| Debt related to hotel properties held for sale | 20,416 | 49,968 | ||||||||
| Long-term debt | 112,405 | 115,877 | ||||||||
| 157,534 | 176,549 | |||||||||
| Redeemable noncontrolling interest in consolidated partnership, at redemption value | - | 114 | ||||||||
| Redeemable preferred stock | ||||||||||
| 10% Series B, 800,000 shares authorized; $.01 par value, 332,500 shares outstanding, liquidation preference of $8,312 | 7,662 |
7,662 |
||||||||
| EQUITY | ||||||||||
| Preferred stock, 40,000,000 shares authorized; | ||||||||||
| 8% Series A, 2,500,000 shares authorized, $.01 par value, 803,270 shares outstanding, liquidation preference of $8,033 | 8 |
8 |
||||||||
| 6.25% Series C, 3,000,000 shares authorized, $.01 par value, 3,000,000 shares outstanding, liquidation preference of $30,000 | 30 | - | ||||||||
| Common stock, $.01 par value, 200,000,000 shares authorized; 23,145,927 and 23,070,387 shares outstanding | 231 | 231 | ||||||||
| Common stock warrants | 252 | 252 | ||||||||
| Additional paid-in capital | 134,792 | 121,619 | ||||||||
| Distributions in excess of retained earnings | (98,777 | ) | (85,398 | ) | ||||||
| Total shareholders' equity | 36,536 | 36,712 | ||||||||
| Noncontrolling interest in consolidated partnership, redemption value $99 and $64 | 115 | 135 | ||||||||
| Total equity | 36,651 | 36,847 | ||||||||
| $ | 201,847 | $ | 221,172 | |||||||
| Supertel Hospitality, Inc. | |||||||||||||||||
| Results of Operations | |||||||||||||||||
| For the three and twelve months ended December 31, 2012 and 2011, respectively | |||||||||||||||||
| (Dollars in thousands, except per share data) | |||||||||||||||||
| Three months | Twelve months | ||||||||||||||||
| ended December 31, | ended December 31, | ||||||||||||||||
| Unaudited | Unaudited | ||||||||||||||||
| 2012 | 2011 | 2012 | 2011 | ||||||||||||||
| REVENUES | |||||||||||||||||
| Room rentals and other hotel services | $ | 16,421 | $ | 15,605 | $ | 70,573 | $ | 67,031 | |||||||||
| EXPENSES | |||||||||||||||||
| Hotel and property operations | 12,692 | 11,967 | 51,921 | 50,047 | |||||||||||||
| Depreciation and amortization | 1,972 | 1,905 | 7,705 | 7,855 | |||||||||||||
| General and administrative | 951 | 874 | 3,908 | 3,884 | |||||||||||||
| Acquisition, termination expense | 62 | 123 | 240 | 124 | |||||||||||||
| Termination cost | - | - | - | 540 | |||||||||||||
| 15,677 | 14,869 | 63,774 | 62,450 | ||||||||||||||
| EARNINGS BEFORE NET GAINS (LOSSES) ON DISPOSITIONS OF ASSETS, OTHER INCOME, INTEREST EXPENSE, AND INCOME TAXES | 744 |
736 |
6,799 |
4,581 |
|||||||||||||
| Net gain (loss) on dispositions of assets | (4 | ) | (1 | ) | 3 | 1,135 | |||||||||||
| Other income (loss) | 1,334 | - | (144 | ) | 107 | ||||||||||||
| Interest expense | (1,956 | ) | (1,920 | ) | (7,450 | ) | (7,706 | ) | |||||||||
| Impairment losses | - | (3,712 | ) | (3,830 | ) | (6,513 | ) | ||||||||||
| EARNINGS (LOSS) BEFORE INCOME TAXES | 118 | (4,897 | ) | (4,622 | ) | (8,396 | ) | ||||||||||
| Income tax (expense) benefit | (6,153 | ) | 147 | (6,637 | ) | 161 | |||||||||||
| LOSS FROM CONTINUING OPERATIONS | (6,035 | ) | (4,750 | ) | (11,259 | ) | (8,235 | ) | |||||||||
| Gain (loss) from discontinued operations | (388 | ) | (3,500 | ) | 1,039 | (9,242 | ) | ||||||||||
| NET LOSS | (6,423 | ) | (8,250 | ) | (10,220 | ) | (17,477 | ) | |||||||||
| Loss attributable to noncontrolling interest | 11 | 26 | 10 | 32 | |||||||||||||
| LOSS ATTRIBUTABLE TO CONTROLLING INTERESTS | (6,412 | ) | (8,224 | ) | (10,210 | ) | (17,445 | ) | |||||||||
| Preferred stock dividends | (838 | ) | (368 | ) | (3,169 | ) | (1,474 | ) | |||||||||
| NET LOSS ATTRIBUTABLE | |||||||||||||||||
| TO COMMON SHAREHOLDERS | $ | (7,250 | ) | $ | (8,592 | ) | $ | (13,379 | ) | $ | (18,919 | ) | |||||
| NET EARNINGS (LOSS) PER COMMON SHARE - BASIC: | |||||||||||||||||
| EPS from continuing operations | $ | (0.30 | ) | $ | (0.22 | ) | $ | (0.62 | ) | $ | (0.42 | ) | |||||
| EPS from discontinued operations | $ | (0.01 | ) | $ | (0.15 | ) | $ | 0.04 | $ | (0.40 | ) | ||||||
| EPS Basic | $ | (0.31 | ) | $ | (0.37 | ) | $ | (0.58 | ) | $ | (0.82 | ) | |||||
| NET EARNINGS PER COMMON SHARE - DILUTED: | |||||||||||||||||
| EPS Diluted | $ | (0.31 | ) | $ | (0.37 | ) | $ | (0.58 | ) | $ | (0.82 | ) | |||||
| RECONCILIATION OF NON-GAAP FINANCIAL MEASURES | |||||||||||||||||
| (Unaudited - In thousands, except per share data) | |||||||||||||||||
| Three months | Twelve months | ||||||||||||||||
| ended December 31, | ended December 31, | ||||||||||||||||
| 2012 | 2011 | 2012 | 2011 | ||||||||||||||
| Weighted average number of shares outstanding for EPS | |||||||||||||||||
| basic | 23,092 | 23,023 | 23,080 | 22,978 | |||||||||||||
| diluted | 23,092 | 23,023 | 23,080 | 22,978 | |||||||||||||
| Weighted average number of shares outstanding for FFO per share | |||||||||||||||||
| basic | 23,092 | 23,023 | 23,080 | 22,978 | |||||||||||||
| diluted | 23,092 | 23,023 | 23,080 | 22,978 | |||||||||||||
| Reconciliation of net earnings (loss) to FFO | |||||||||||||||||
| Net earnings (loss) available to common shareholders | $ | (7,250 | ) | $ | (8,592 | ) | $ | (13,379 | ) | $ | (18,919 | ) | |||||
| Depreciation and amortization, including discontinued operations | 2,135 | 2,312 | 8,787 | 9,996 | |||||||||||||
| Net (gains) losses on disposition of continuing and discontinued assets | (2,006 | ) | 9 | (7,833 | ) | (1,452 | ) | ||||||||||
| Impairment | 1,923 | 6,485 | 10,172 | 14,308 | |||||||||||||
| FFO available to common shareholders | $ | (5,198 | ) | $ | 214 | $ | (2,253 | ) | $ | 3,933 | |||||||
| Unrealized loss on derivatives | 1,332 | - | (247 | ) | - | ||||||||||||
| Acquisitions expense | (62 | ) | (123 | ) | (240 | ) | (124 | ) | |||||||||
| Adjusted FFO | $ | (6,468 | ) | $ | 337 | $ | (1,766 | ) | $ | 4,057 | |||||||
| FFO per share - basic | $ | (0.23 | ) | $ | 0.01 | $ | (0.10 | ) | $ | 0.17 | |||||||
| Adjusted FFO per share - basic | $ | (0.28 | ) | $ | 0.01 | $ | (0.08 | ) | $ | 0.18 | |||||||
| FFO per share - diluted | $ | (0.23 | ) | $ | 0.01 | $ | (0.10 | ) | $ | 0.17 | |||||||
| Adjusted FFO per share - diluted | $ | (0.28 | ) | $ | 0.01 | $ | (0.08 | ) | $ | 0.18 | |||||||
FFO and Adjusted FFO ("AFFO") are non-GAAP financial measures. We consider FFO and AFFO to be market accepted measures of an equity REIT's operating performance, which are necessary, along with net earnings (loss), for an understanding of our operating results. FFO, as defined under the National Association of Real Estate Investment Trusts (NAREIT) standards, consists of net income computed in accordance with GAAP, excluding gains (or losses) from sales of real estate assets, plus depreciation and amortization of real estate assets. We believe our method of calculating FFO complies with the NAREIT definition. AFFO is FFO adjusted to exclude gains or losses on derivative liabilities, which are non-cash charges against income and which do not represent results from our core operations. AFFO also adds back acquisition costs. FFO and AFFO do not represent amounts available for management's discretionary use because of needed capital replacement or expansion, debt service obligations, or other commitments and uncertainties. FFO and AFFO should not be considered as alternatives to net income (loss) (computed in accordance with GAAP) as an indicator of our liquidity, nor are they indicative of funds available to fund our cash needs, including our ability to pay dividends or make distributions. All REITs do not calculate FFO and AFFO in the same manner; therefore, our calculation may not be the same as the calculation of FFO and AFFO for similar REITs.
Diluted FFO per share and diluted Adjusted FFO per share are computed after adjusting the numerator and denominator of the basic computation for the effects of any dilutive potential common shares outstanding during the period. The Company's outstanding warrants to purchase common stock Series C convertible preferred stock, preferred operating units, unvested stock awards and stock options would be antidilutive and are not included in the dilution computation.
We use FFO and AFFO as performance measures to facilitate a periodic evaluation of our operating results relative to those of our peers. We consider FFO and AFFO to be useful additional measures of performance for an equity REIT because it facilitates an understanding of the operating performance of our properties without giving effect to real estate depreciation and amortization, which assume that the value of real estate assets diminishes predictably over time. Since real estate values have historically risen or fallen with market conditions, we believe that FFO and AFFO provide a meaningful indication of our performance.
| EBITDA and Adjusted EBITDA | ||||||||||||||||||
| (Unaudited - In thousands, except statistical data) | ||||||||||||||||||
| Three months | Twelve months | |||||||||||||||||
| ended December 31, | ended December 31, | |||||||||||||||||
| 2012 | 2011 | 2012 | 2011 | |||||||||||||||
| RECONCILIATION OF NET EARNINGS (LOSS) TO ADJUSTED EBITDA | ||||||||||||||||||
| Net loss available to common shareholders | $ | (7,250 | ) | $ | (8,592 | ) | $ | (13,379 | ) | $ | (18,919 | ) | ||||||
| Interest expense, including discontinued operations | 2,461 | 2,976 | 10,060 | 12,402 | ||||||||||||||
| Income tax expense (benefit), including discontinued operations | 5,835 | (665 | ) | 5,610 | (1,904 | ) | ||||||||||||
| Depreciation and amortization, including discontinued operations | 2,135 | 2,312 | 8,787 | 9,996 | ||||||||||||||
| EBITDA | 3,181 | (3,969 | ) | 11,078 | 1,575 | |||||||||||||
| Noncontrolling interest | (11 | ) | (26 | ) | (10 | ) | (32 | ) | ||||||||||
| Net (gain) loss on disposition of assets | (2,006 | ) | 9 | (7,833 | ) | (1,452 | ) | |||||||||||
| Impairment | 1,923 | 6,485 | 10,172 | 14,308 | ||||||||||||||
| Preferred stock dividend | 838 | 368 | 3,169 | 1,474 | ||||||||||||||
| Unrealized (gain) loss on derivatives | (1,332 | ) | - | 247 | - | |||||||||||||
| Acquisition expense | 62 | 123 | 240 | 124 | ||||||||||||||
| Adjusted EBITDA | $ | 2,655 | $ | 2,990 | $ | 17,063 | $ | 15,997 | ||||||||||
EBITDA and Adjusted EBITDA are financial measures that are not calculated in accordance with accounting principles generally accepted in the United States of America ("GAAP"). We calculate EBITDA and Adjusted EBITDA by adding back to net earnings (loss) available to common shareholders certain non-operating expenses and non-cash charges which are based on historical cost accounting and we believe may be of limited significance in evaluating current performance. We believe these adjustments can help eliminate the accounting effects of depreciation and amortization and financing decisions and facilitate comparisons of core operating profitability between periods, even though EBITDA and Adjusted EBITDA also do not represent an amount that accrues directly to common shareholders. In calculating Adjusted EBITDA, we add back noncontrolling interest, net (gain) loss on disposition of assets, preferred stock dividends and acquisition expenses which are cash charges. We also add back impairment and unrealized gain or loss on derivatives, which are non-cash charges.
EBITDA and Adjusted EBITDA do not represent cash generated from operating activities determined by GAAP and should not be considered as alternatives to net income, cash flow from operations or any other operating performance measure prescribed by GAAP. EBITDA and Adjusted EBITDA are not measures of our liquidity, nor are they indicative of funds available to fund our cash needs, including our ability to make cash distributions. Neither do the measurements reflect cash expenditures for long-term assets and other items that have been and will be incurred. EBITDA and Adjusted EBITDA may include funds that may not be available for management's discretionary use due to functional requirements to conserve funds for capital expenditures, property acquisitions, and other commitments and uncertainties. To compensate for this, management considers the impact of these excluded items to the extent they are material to operating decisions or the evaluation of our operating performance. EBITDA and Adjusted EBITDA, as presented, may not be comparable to similarly titled measures of other companies.
| Supertel Hospitality, Inc. | |||||||||||||||
| Operating Statistics by Chain Scale Classification - Hotels in Continuing Operations | |||||||||||||||
| For the three and twelve months ended December 31, 2012 and 2011, respectively | |||||||||||||||
| (Unaudited - except statistical data) | |||||||||||||||
| Three months | Twelve months | ||||||||||||||
| ended December 31, | ended December 31, | ||||||||||||||
| 2012 | 2011 | 2012 | 2011 | ||||||||||||
| Same Store: | |||||||||||||||
| Revenue per available room (RevPAR): | |||||||||||||||
| Upper Midscale | $ | 41.97 | $ | 42.56 | $ | 47.11 | $ | 45.71 | |||||||
| Midscale | $ | 28.14 | $ | 27.55 | $ | 31.92 | $ | 27.88 | |||||||
| Economy | $ | 29.18 | $ | 29.09 | $ | 32.17 | $ | 32.00 | |||||||
| Extended Stay | $ | 16.65 | $ | 16.20 | $ | 17.27 | $ | 17.14 | |||||||
| Total | $ | 30.09 | $ | 30.09 | $ | 33.21 | $ | 32.58 | |||||||
| Average daily room rate (ADR): | |||||||||||||||
| Upper Midscale | $ | 71.14 | $ | 70.76 | $ | 71.01 | $ | 70.24 | |||||||
| Midscale | $ | 63.07 | $ | 62.80 | $ | 64.37 | $ | 63.30 | |||||||
| Economy | $ | 51.20 | $ | 50.35 | $ | 51.67 | $ | 50.70 | |||||||
| Extended Stay | $ | 24.94 | $ | 23.87 | $ | 24.70 | $ | 23.79 | |||||||
| Total | $ | 50.93 | $ | 50.18 | $ | 51.51 | $ | 50.29 | |||||||
| Occupancy percentage: | |||||||||||||||
| Upper Midscale | 59.0% | 60.1% | 66.3% | 65.1% | |||||||||||
| Midscale | 44.6% | 43.9% | 49.6% | 44.0% | |||||||||||
| Economy | 57.0% | 57.8% | 62.3% | 63.1% | |||||||||||
| Extended Stay | 66.7% | 67.9% | 69.9% | 72.0% | |||||||||||
| Total | 59.1% | 60.0% | 64.5% | 64.8% | |||||||||||
Same store reflects 63 hotels.
| Supertel Hospitality, Inc. |
| Property Operating Income (POI) - Continuing and Discontinued Operations |
This presentation includes non-GAAP financial measures. The company believes that the presentation of hotel property operating income (POI) is helpful to investors, and represents a more useful description of its core operations, as it better communicates the comparability of its hotels' operating results.
| Unaudited-In thousands, except statistical data: | Three months | Twelve months | ||||||||||||
| ended December 31, | ended December 31, | |||||||||||||
| 2012 | 2011 | 2012 | 2011 | |||||||||||
| Total Hotels in Continuing Operations: | ||||||||||||||
| Revenue per available room (RevPAR): | $ | 30.89 | $ | 30.09 | $ | 33.79 | $ | 32.58 | ||||||
| Average daily room rate (ADR): | $ | 52.25 | $ | 50.18 | $ | 52.36 | $ | 50.29 | ||||||
| Occupancy percentage: | 59.1% | 60.0% | 64.5% | 64.8% | ||||||||||
| Revenue from room rentals and other hotel services consists of: | ||||||||||||||
| Room rental revenue | $ | 15,787 | $ | 15,106 | $ | 68,212 | $ | 64,882 | ||||||
| Telephone revenue | 71 | 73 | 290 | 293 | ||||||||||
| Other hotel service revenues | 563 | 426 | 2,071 | 1,856 | ||||||||||
| Total revenue from room rentals and other hotel services | $ | 16,421 | $ | 15,605 | $ | 70,573 | $ | 67,031 | ||||||
| Room rentals and other hotel services | ||||||||||||||
| Total room rental and other hotel services | $ | 16,421 | $ | 15,605 | $ | 70,573 | $ | 67,031 | ||||||
| Hotel and property operations expense | ||||||||||||||
| Total hotel and property operations expense | $ | 12,692 | $ | 11,967 | $ | 51,921 | $ | 50,047 | ||||||
| Property Operating Income ("POI") | ||||||||||||||
| Total property operating income | $ | 3,729 | $ | 3,638 | $ | 18,652 | $ | 16,984 | ||||||
| POI as a percentage of revenue from room rentals and other hotel services | ||||||||||||||
| Total POI as a percentage of revenue | 22.7% | 23.3% | 26.4% | 25.3% | ||||||||||
| Discontinued Operations | ||||||||||||||
| Room rentals and other hotel services | ||||||||||||||
| Total room rental and other hotel services | $ | 4,744 | $ | 6,229 | $ | 24,777 | $ | 30,876 | ||||||
| Hotel and property operations expense | ||||||||||||||
| Total hotel and property operations expense | $ | 4,869 | $ | 6,003 | $ | 22,561 | $ | 27,496 | ||||||
| Property Operating Income ("POI") | ||||||||||||||
| Total property operating income | $ | (125 | ) | $ | 226 | $ | 2,216 | $ | 3,380 | |||||
| POI as a percentage of revenue from room rentals and other hotel services | ||||||||||||||
| Total POI as a percentage of revenue | -2.6% | 3.6% | 8.9% | 10.9% | ||||||||||
| (Unaudited - In thousands, except statistical data) | ||||||||||||||||
| RECONCILIATION OF NET LOSS TO POI | Three months | Twelve months | ||||||||||||||
| ended December 31, | ended December 31, | |||||||||||||||
| 2012 | 2011 | 2012 | 2011 | |||||||||||||
| Net loss | $ | (6,423 | ) | $ | (8,250 | ) | $ | (10,220 | ) | $ | (17,477 | ) | ||||
| Depreciation and amortization, including discontinued operations | 2,135 | 2,312 | 8,787 | 9,996 | ||||||||||||
| Net gain on disposition of assets, including discontinued operations | (2,006 | ) | 9 | (7,833 | ) | (1,452 | ) | |||||||||
| Other income | (1,334 | ) | - | 144 | (107 | ) | ||||||||||
| Interest expense, including discontinued operations | 2,461 | 2,976 | 10,060 | 12,402 | ||||||||||||
| General and administrative expense | 951 | 874 | 3,908 | 3,934 | ||||||||||||
| Acquisition expense | 62 | 123 | 240 | 124 | ||||||||||||
| Impairment losses | 1,923 | 6,485 | 10,172 | 14,308 | ||||||||||||
| Termination cost | - | - | - | 540 | ||||||||||||
| Income tax expense (benefit), including discontinued operations | 5,835 | (665 | ) | 5,610 | (1,904 | ) | ||||||||||
| Room rentals and other hotel services - discontinued operations | (4,744 | ) | (6,229 | ) | (24,777 | ) | (30,876 | ) | ||||||||
| Hotel and property operations expense - discontinued operations | 4,869 | 6,003 | 22,561 | 27,496 | ||||||||||||
| POI--continuing operations | $ | 3,729 | $ | 3,638 | $ | 18,652 | $ | 16,984 | ||||||||
| Three months | Twelve months | |||||||||||||||
| ended December 31, | ended December 31, | |||||||||||||||
| Reconciliation of gain (loss) from discontinued operations to POI - discontinued operations | 2012 | 2011 | 2012 | 2011 | ||||||||||||
| Gain (loss) from discontinued operations | $ | (388 | ) | $ | (3,500 | ) | $ | 1,039 | $ | (9,242 | ) | |||||
| Depreciation and amortization from discontinued operations | 163 | 407 | 1,082 | 2,141 | ||||||||||||
| Net gain on disposition of assets from discontinued operations | (2,010 | ) | 8 | (7,830 | ) | (317 | ) | |||||||||
| Interest expense from discontinued operations | 505 | 1,056 | 2,610 | 4,696 | ||||||||||||
| General and administrative expense from discontinued operations | - | - | - | 50 | ||||||||||||
| Impairment losses from discontinued operations | 1,923 | 2,773 | 6,342 | 7,795 | ||||||||||||
| Income tax benefit from discontinued operations | (318 | ) | (518 | ) | (1,027 | ) | (1,743 | ) | ||||||||
| POI--discontinued operations | $ | (125 | ) | $ | 226 | $ | 2,216 | $ | 3,380 | |||||||
| Three months | Twelve months | |||||||||||||||
| ended December 31, | ended December 31, | |||||||||||||||
| 2012 | 2011 | 2012 | 2011 | |||||||||||||
| POI--continuing operations | 3,729 | 3,638 | 18,652 | 16,984 | ||||||||||||
| POI--discontinued operations | (125 | ) | 226 | 2,216 | 3,380 | |||||||||||
| Total - POI | $ | 3,604 | $ | 3,864 | $ | 20,868 | $ | 20,364 | ||||||||
| Total POI as a percentage of revenues | 17.0 | % | 17.7 | % | 21.9 | % | 20.8 | % | ||||||||
Same Store reflects 63 hotels in continuing operations owned as of January 1, 2011 and excludes one property acquired during the second quarter of 2012.
| Supertel Hospitality, Inc. |
| Operating Statistics by Region |
| For the three months ended December 31, 2012 and 2011, respectively |
The comparisons of same store operations are for 63 hotels in continuing operations as of October 1, 2011.
| (Unaudited - except per share data) | ||||||||||||||||||||
| Three months ended December 31, 2012 | Three months ended December 31, 2011 | |||||||||||||||||||
| Same Store | Room | Room | ||||||||||||||||||
| Region | Count | RevPAR | Occupancy | ADR | Count | RevPAR | Occupancy | ADR | ||||||||||||
| Mountain | 214 | $ | 30.89 | 59.9% | $ | 51.59 | 214 | $ | 25.37 | 52.5% | $ | 48.31 | ||||||||
| West North Central | 1,352 | 30.17 | 58.4% | 51.66 | 1,352 | 29.93 | 60.2% | 49.73 | ||||||||||||
| East North Central | 923 | 34.93 | 54.0% | 64.73 | 923 | 33.81 | 51.1% | 66.13 | ||||||||||||
| Middle Atlantic/New England | 142 | 44.35 | 71.1% | 62.37 | 142 | 44.12 | 78.0% | 56.53 | ||||||||||||
| South Atlantic | 2,169 | 26.51 | 62.6% | 42.35 | 2,169 | 26.91 | 64.0% | 42.08 | ||||||||||||
| East South Central | 431 | 37.15 | 56.6% | 65.59 | 431 | 39.70 | 60.5% | 65.66 | ||||||||||||
| West South Central | 225 | 20.96 | 46.4% | 45.17 | 225 | 23.69 | 51.3% | 46.17 | ||||||||||||
| Total Same Store Hotels | 5,456 | $ | 30.09 | 59.1% | $ | 50.93 | 5,456 | $ | 30.09 | 60.0% | $ | 50.18 | ||||||||
| South Atlantic Acquisitions | ||||||||||||||||||||
| Total Acquisitions | 100 | 74.41 | 61.5% | 121.08 | - | - | 0.0% | - | ||||||||||||
| Total Acquisitions | 100 | $ | 74.41 | 61.5% | $ | 121.08 | - | $ | - | 0.0% | $ | - | ||||||||
| Total Continuing Operations | 5,556 | $ | 30.89 | 59.1% | $ | 52.25 | 5,456 | $ | 30.09 | 60.0% | $ | 50.18 | ||||||||
| States included in the Regions | |
| Mountain | Idaho and Montana |
| West North Central | Iowa, Kansas, Missouri, Nebraska and South Dakota |
| East North Central | Indiana and Wisconsin |
| Middle Atlantic | Pennsylvania |
| South Atlantic | Florida, Georgia, Maryland, North Carolina, South Carolina, Virginia and West Virginia |
| East South Central | Kentucky and Tennessee |
| West South Central | Arkansas and Louisiana |
| Supertel Hospitality, Inc. |
| Operating Statistics by Region |
| For the twelve months ended December 31, 2012 and 2011, respectively |
The comparisons of same store operations are for 63 hotels in continuing operations as of January 1, 2011.
| (Unaudited - except per share data) | ||||||||||||||||||||
| 2012 | 2011 | |||||||||||||||||||
| Same Store | Room | Room | ||||||||||||||||||
| Region | Count | RevPAR | Occupancy | ADR | Count | RevPAR | Occupancy | ADR | ||||||||||||
| Mountain | 214 | $ | 35.81 | 68.5% | $ | 52.27 | 214 | $ | 32.05 | 63.8% | $ | 50.23 | ||||||||
| West North Central | 1,352 | 32.59 | 63.4% | 51.38 | 1,352 | 31.65 | 63.8% | 49.58 | ||||||||||||
| East North Central | 923 | 37.48 | 59.1% | 63.41 | 923 | 36.54 | 57.5% | 63.50 | ||||||||||||
| Middle Atlantic | 142 | 44.67 | 73.2% | 61.06 | 142 | 43.52 | 75.3% | 57.83 | ||||||||||||
| South Atlantic | 2,169 | 30.16 | 68.2% | 44.19 | 2,169 | 29.66 | 68.8% | 43.11 | ||||||||||||
| East South Central | 431 | 41.24 | 62.1% | 66.38 | 431 | 40.66 | 62.0% | 65.62 | ||||||||||||
| West South Central | 225 | 23.74 | 51.4% | 46.17 | 225 | 28.17 | 61.2% | 46.02 | ||||||||||||
| Total Same Store Hotels | 5,456 | $ | 33.21 | 64.5% | $ | 51.51 | 5,456 | $ | 32.58 | 64.8% | $ | 50.29 | ||||||||
| South Atlantic Acquisitions | 100 | 85.90 | 69.8% | 123.03 | - | - | 0.0% | - | ||||||||||||
| Total Acquisitions | 100 | $ | 85.90 | 69.8% | $ | 123.03 | - | $ | - | 0.0% | $ | - | ||||||||
| Total Continuing Operations | 5,556 | $ | 33.79 | 64.5% | $ | 52.36 | 5,456 | $ | 32.58 | 64.8% | $ | 50.29 | ||||||||
| States included in the Regions | |
| Mountain | Idaho and Montana |
| West North Central | Iowa, Kansas, Missouri, Nebraska and South Dakota |
| East North Central | Indiana and Wisconsin |
| Middle Atlantic/New England | Pennsylvania |
| South Atlantic | Florida, Georgia, Maryland, North Carolina, South Carolina, Virginia and West Virginia |
| East South Central | Kentucky and Tennessee |
| West South Central | Arkansas and Louisiana |
The following properties have been moved from the same store portfolio during the reporting period and classified as held for sale:
Louisville, KY Comfort Suites
Omaha, NE Sleep Inn
Louisville, KY Sleep Inn
Fredericksburg, VA (South) Days Inn
Shreveport, LA Days Inn
Fort Madison, IA Super 8
Jefferson City, MO Super 8
Shawano, WI Super 8
Ellenton, FL Guesthouse Inn
Contact Information:
Contact:
Ms. Krista Arkfeld
Director of Corporate Communications
karkfeld@supertelinc.com